please read carefully, Thank you!
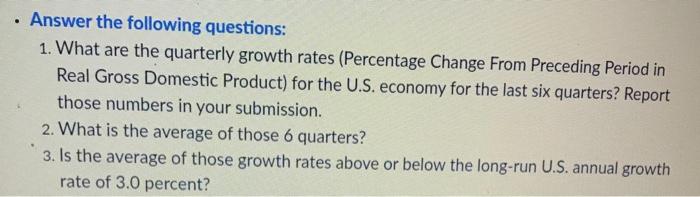
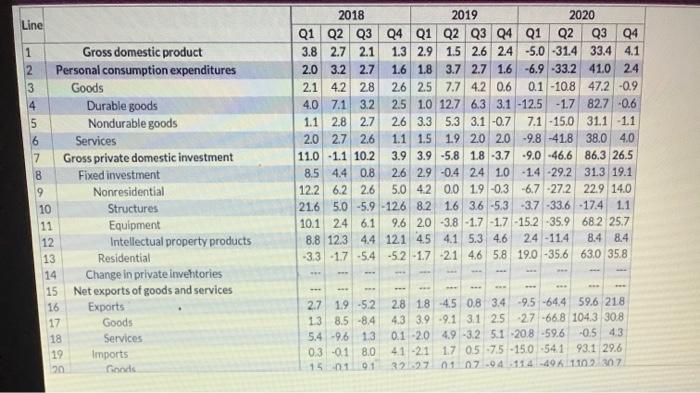
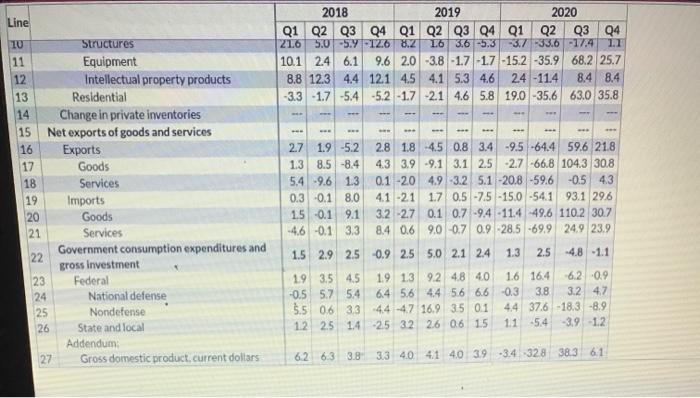
Line 1 Gross domestic product 2 Personal consumption expenditures 3 Goods 4 Durable goods 5 Nondurable goods 6 Services Gross private domestic investment 8 Fixed investment 9 Nonresidential 10 Structures 11 Equipment 12 Intellectual property products 13 Residential 14 Change in private inventories 15 Net exports of goods and services 16 Exports 17 Goods 18 Services 19 Imports 20 Goods 2018 2019 2020 Q1 Q2 Q3 Q4 Q1 Q2 Q3 Q4 Q1 Q2 Q3 94 3.8 2.7 2.1 1.3 2.9 1.5 2.6 24 -5.0 -31.4 33.4 4.1 2.0 3.2 2.7 1.6 1.8 3.7 2.7 1.6 -6.9 -33.2 41.0 24 2.1 4.2 28 26 25 7.7 4.2 0.6 0.1 -10.8 47.2 -0.9 4.0 7.1 3.2 2.5 1.0 12.7 6.3 3.1 -12.5 -1.7 82.7 -0.6 1.1 2.8 2.7 2.6 3.3 5.3 3.1 -0.7 7.1 -15.0 31.1 -1.1 2.0 2.7 2.6 1.1 1.5 1.9 2.0 2.0 -9.8 -41.8 38.0 4.0 11.0 -1.1 10.2 3.9 3.9 -5.8 1.8 -3.7 -9.0 -46.6 86.3 26.5 8.5 4.4 0.8 2.6 2.9 -0.4 24 10 -14 -29.2 31.3 19.1 12.2 6.2 2.6 5.0 4.2 0.0 1.9 -0.3 6.7 27.2 22.9 14.0 21.6 5.0 -5.9 -12.6 8.2 1.6 3.6-5.3 3.7 -33.6 -17.4 1.1 10.1 2.4 6.1 9.6. 20 -3.8 -1.7 -1.7 -15.2 -35.9 682 25.7 8.8 12.3 4.4 121 45 4.1 5.3 4.6 24 -11.4 8.4 8.4 -3.3 -1.7 -5,4 -5.2 -17 21 4.6 5.8 19.0 -35.6 63.0 35.8 2.7 1.9 -5.2 13 8.5 8.4 5.4 -96 1.3 0.3 -01 8.0 15 01 91 28 18 -4.5 0.8 3.4 -9.5 -644 59.6 21.8 43 3.9 -9.1 3.1 25 27 -668 1043 30.8 0.1 20 49 -3.2 5.1 20.8 -59.6 -0.5 43 41 -21 17 05 75 -150-541 93.1 29.6 32 27 01 07.04.114 -496 1102 307 Line 2018 2019 2020 Q1 Q2 Q3 Q4 Q1 Q2 Q3 Q4 Q1 Q2 Q3 Q4 21.6 5.0 5.4 126 8.7 1.6 3.6-5.3 -3.7 -33.6 -17.4 1.1 10.1 2.4 6.1 9.6 2.0 -3.8 -1.7 -1.7 -15.2 -35.9 68.2 25.7 8.8 12.3 4.4 121 4.5 4.1 5.3 4.6 24 -11.4 8.4 8.4 -3.3 -1.7 -5,4 -5.2 -1.7 -2.1 4.6 5.8 19.0 -35.6 63.0 35.8 10 Structures 11 Equipment 12 Intellectual property products 13 Residential 14 Change in private inventories 15 Net exports of goods and services 16 Exports 17 Goods 18 Services 19 Imports 20 Goods 21 Services 22 Government consumption expenditures and gross Investment 23 Federal 24 National defense 25 Nondefense 26 State and local Addendum: 27 Gross domestic product, current dollars 2.7 1.9 -5.2 1.3 8.5 -8.4 5.4 -9.6 1.3 0.3 -0.1 8.0 1.5 -0.1 9.1 -4.6 -0.1 3.3 2.8 1.8 4.5 0.8 3.4 -9.5 -64.4 59.6 218 4.3 3.9 -9.1 3.1 2.5 2.7 -66.8 104.3 30.8 0.1 -20 4.9 -3.2 5.1 -20.8 -59.6 -0.5 43 41 -21 1.7 0.5 -7.5 -15.0 -541 93.1 29.6 3.2 -2.7 0.1 0.7 -94 -11.4 -49.6 110.2 30.7 8.4 0.6 9.0 -0.7 0.9 -28.5 -69.9 24.9 23.9 1.5 2.9 2.5 0.9 2.5 5.0 2.1 2.4 1.3 2.5 -4.8 -1.1 19 3.5 4.5 1.9 13 92 48 40 -0.5 5.7 5.4 6.4 56 4.4 56 6.6 5.5 0.6 33 44 47 16.9 3.5 0.1 12 2.5 1.425 32 2.6 06 15 1.6 16.4 62 0.9 -0.3 38 3.2 4.7 4.4 37.6 -18.3 -8.9 11 -54 -3.9 12 6.2 6.3 3.8 33 40 41 40 3.9-3.4 328 38.3 6.1 Answer the following questions: 1. What are the quarterly growth rates (Percentage Change From Preceding Period in Real Gross Domestic Product) for the U.S. economy for the last six quarters? Report those numbers in your submission. 2. What is the average of those 6 quarters? 3. Is the average of those growth rates above or below the long-run U.S. annual growth rate of 3.0 percent? Line 1 Gross domestic product 2 Personal consumption expenditures 3 Goods 4 Durable goods 5 Nondurable goods 6 Services Gross private domestic investment 8 Fixed investment 9 Nonresidential 10 Structures 11 Equipment 12 Intellectual property products 13 Residential 14 Change in private inventories 15 Net exports of goods and services 16 Exports 17 Goods 18 Services 19 Imports 20 Goods 2018 2019 2020 Q1 Q2 Q3 Q4 Q1 Q2 Q3 Q4 Q1 Q2 Q3 94 3.8 2.7 2.1 1.3 2.9 1.5 2.6 24 -5.0 -31.4 33.4 4.1 2.0 3.2 2.7 1.6 1.8 3.7 2.7 1.6 -6.9 -33.2 41.0 24 2.1 4.2 28 26 25 7.7 4.2 0.6 0.1 -10.8 47.2 -0.9 4.0 7.1 3.2 2.5 1.0 12.7 6.3 3.1 -12.5 -1.7 82.7 -0.6 1.1 2.8 2.7 2.6 3.3 5.3 3.1 -0.7 7.1 -15.0 31.1 -1.1 2.0 2.7 2.6 1.1 1.5 1.9 2.0 2.0 -9.8 -41.8 38.0 4.0 11.0 -1.1 10.2 3.9 3.9 -5.8 1.8 -3.7 -9.0 -46.6 86.3 26.5 8.5 4.4 0.8 2.6 2.9 -0.4 24 10 -14 -29.2 31.3 19.1 12.2 6.2 2.6 5.0 4.2 0.0 1.9 -0.3 6.7 27.2 22.9 14.0 21.6 5.0 -5.9 -12.6 8.2 1.6 3.6-5.3 3.7 -33.6 -17.4 1.1 10.1 2.4 6.1 9.6. 20 -3.8 -1.7 -1.7 -15.2 -35.9 682 25.7 8.8 12.3 4.4 121 45 4.1 5.3 4.6 24 -11.4 8.4 8.4 -3.3 -1.7 -5,4 -5.2 -17 21 4.6 5.8 19.0 -35.6 63.0 35.8 2.7 1.9 -5.2 13 8.5 8.4 5.4 -96 1.3 0.3 -01 8.0 15 01 91 28 18 -4.5 0.8 3.4 -9.5 -644 59.6 21.8 43 3.9 -9.1 3.1 25 27 -668 1043 30.8 0.1 20 49 -3.2 5.1 20.8 -59.6 -0.5 43 41 -21 17 05 75 -150-541 93.1 29.6 32 27 01 07.04.114 -496 1102 307 Line 2018 2019 2020 Q1 Q2 Q3 Q4 Q1 Q2 Q3 Q4 Q1 Q2 Q3 Q4 21.6 5.0 5.4 126 8.7 1.6 3.6-5.3 -3.7 -33.6 -17.4 1.1 10.1 2.4 6.1 9.6 2.0 -3.8 -1.7 -1.7 -15.2 -35.9 68.2 25.7 8.8 12.3 4.4 121 4.5 4.1 5.3 4.6 24 -11.4 8.4 8.4 -3.3 -1.7 -5,4 -5.2 -1.7 -2.1 4.6 5.8 19.0 -35.6 63.0 35.8 10 Structures 11 Equipment 12 Intellectual property products 13 Residential 14 Change in private inventories 15 Net exports of goods and services 16 Exports 17 Goods 18 Services 19 Imports 20 Goods 21 Services 22 Government consumption expenditures and gross Investment 23 Federal 24 National defense 25 Nondefense 26 State and local Addendum: 27 Gross domestic product, current dollars 2.7 1.9 -5.2 1.3 8.5 -8.4 5.4 -9.6 1.3 0.3 -0.1 8.0 1.5 -0.1 9.1 -4.6 -0.1 3.3 2.8 1.8 4.5 0.8 3.4 -9.5 -64.4 59.6 218 4.3 3.9 -9.1 3.1 2.5 2.7 -66.8 104.3 30.8 0.1 -20 4.9 -3.2 5.1 -20.8 -59.6 -0.5 43 41 -21 1.7 0.5 -7.5 -15.0 -541 93.1 29.6 3.2 -2.7 0.1 0.7 -94 -11.4 -49.6 110.2 30.7 8.4 0.6 9.0 -0.7 0.9 -28.5 -69.9 24.9 23.9 1.5 2.9 2.5 0.9 2.5 5.0 2.1 2.4 1.3 2.5 -4.8 -1.1 19 3.5 4.5 1.9 13 92 48 40 -0.5 5.7 5.4 6.4 56 4.4 56 6.6 5.5 0.6 33 44 47 16.9 3.5 0.1 12 2.5 1.425 32 2.6 06 15 1.6 16.4 62 0.9 -0.3 38 3.2 4.7 4.4 37.6 -18.3 -8.9 11 -54 -3.9 12 6.2 6.3 3.8 33 40 41 40 3.9-3.4 328 38.3 6.1 Answer the following questions: 1. What are the quarterly growth rates (Percentage Change From Preceding Period in Real Gross Domestic Product) for the U.S. economy for the last six quarters? Report those numbers in your submission. 2. What is the average of those 6 quarters? 3. Is the average of those growth rates above or below the long-run U.S. annual growth rate of 3.0 percent