

Answered step by step
Verified Expert Solution
Question
1 Approved Answer
Please read question carefully and answer all parts 2) Falling Drops Imagine a solid sphere of diameter, d, falling through the air. After its release,
Please read question carefully and answer all parts
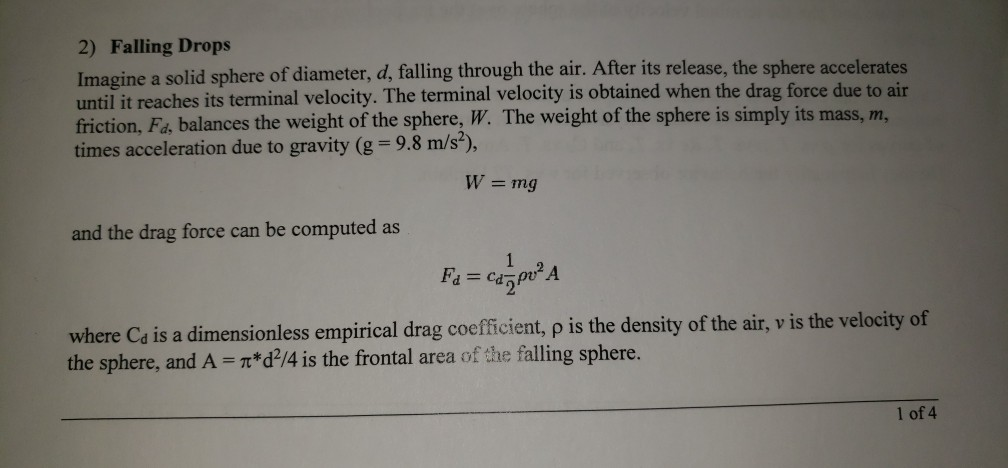
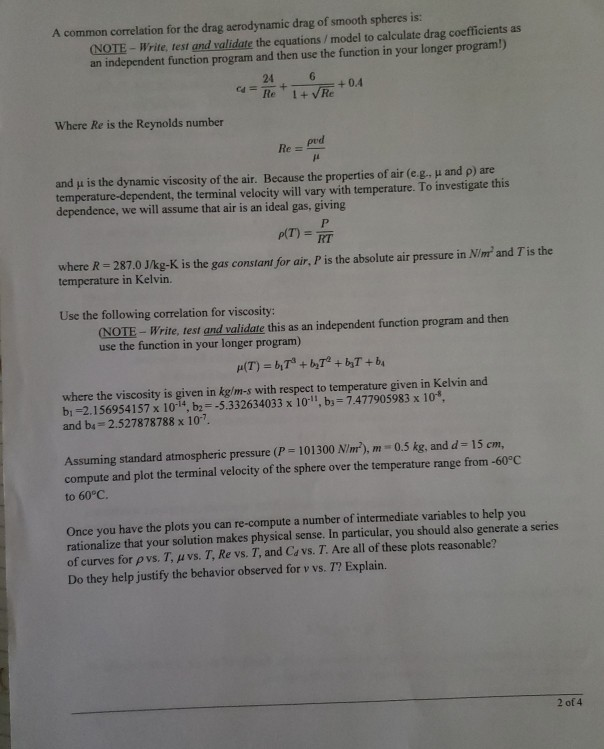
2) Falling Drops Imagine a solid sphere of diameter, d, falling through the air. After its release, the sphere accelerates until it reaches its terminal velocity. The terminal friction, Fa, balances the weight of the sphere, W. The weight of the sphere is simply its mass, m, times acceleration due to gravity (g -9.8 m/s?), Wmg and the drag force can be computed as where Ca is a dimensionles the sphere, and A-*d2/4 is the frontal area of the falling sphere. s empirical drag coefficient, is the density of the air, v is the velocity of 1 of 4 A common correlation for the drag aerodynamic drag of smooth spheres is: NOTE- Write, test and validate the equations / model to calculate drag coefficients as an independent function program and then use the function in your longer program!) 24 +0.4 Where Re is the Reynolds number prd and ju is the dynamic viscosity of the air. Because the properties of air (e.g., u and p) are temperature-dependent, the terminal velocity will vary with temperature. To investigate this dependence, we will assume that air is an ideal gas, giving where R-287.0 J/kg-K is the gas constant for air, P is the absolute air pressure in Nim and T is the temperature in Kelvin. Use the following correlation for viscosity: NOTE- Write, test and validate this as an independent function program and then use the function in your longer program) where the viscosity is given in kgim-s with respect to temperature given in Kelvin and bi-2.156954157 x 10⁻¹⁴, b2 5.332634033 x 10, bs 7.477905983 x 10*. and ba- 2.527878788 x 10. Assuming standard atmospheric pressure (P 101300 Nim), m 0.5 kg, and d 15 cm compute and plot the terminal velocity of the sphere over the temperature range from -60C to 60C. Once you have the plots you can re-compute a number of intermediate variables to help you rationalize that your solution makes physical sense. In particular, you should also generate a series of curves for vs. T, vs. T, Re vs. T, and Cd vs. T. Are all of these plots reasonable? Do they help justify the behavior observed for v vs. T? Explain. 2 of 4
Step by Step Solution
There are 3 Steps involved in it
Step: 1

Get Instant Access to Expert-Tailored Solutions
See step-by-step solutions with expert insights and AI powered tools for academic success
Step: 2

Step: 3
Ace Your Homework with AI
Get the answers you need in no time with our AI-driven, step-by-step assistance
Get Started
Machine Learning And Knowledge Discovery In Databases European Conference Ecml Pkdd 2016 Riva Del Garda Italy September 19 23 2016 Proceedings Part 1 Lnai 9851
Authors: Paolo Frasconi ,Niels Landwehr ,Giuseppe Manco ,Jilles Vreeken
1st Edition
3319461273, 978-3319461274