

Question: Please read the case and answer the following questions for this case: Briefly analyze each of the business models for the industry analysis (Porter's 5
- Briefly analyze each of the business models for the industry analysis (Porter's 5 Forces, the 4'p of marketing, the PLC model, the PESTLE analysis, and consumer buying behavior) as it relates to the case. Then, comprehensive a concluding paragraph combining the findings from all of the models.
- Briefly analyze each competitive position analysis business models (SWOT analysis the organization (perhaps one other competitor), the type of generic business strategy used, the company's competitive advantage, and also core competencies) as it relates to the organization. Then, comprehensive a concluding paragraph combining the findings from all of the models.
- Include the specific financial information from the case (sales and profitability trends, etc....)
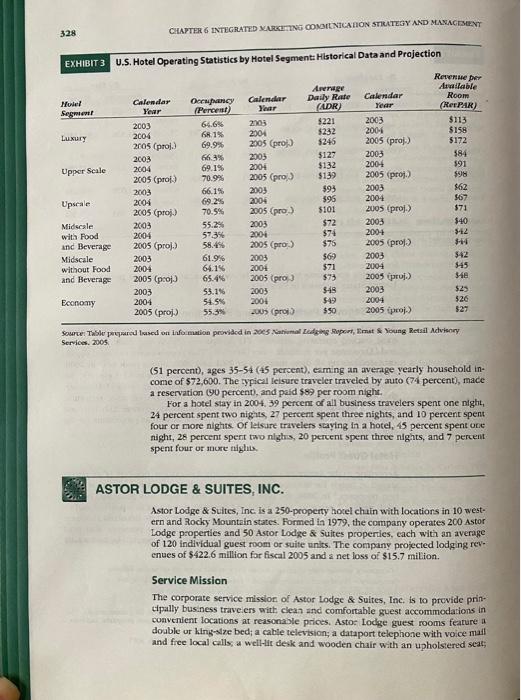
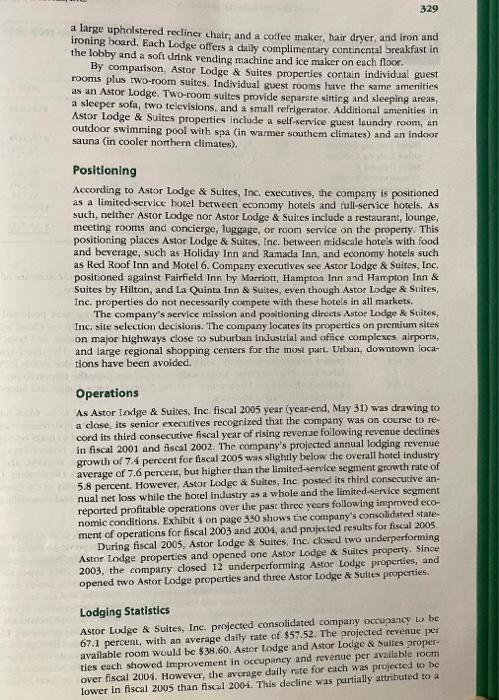
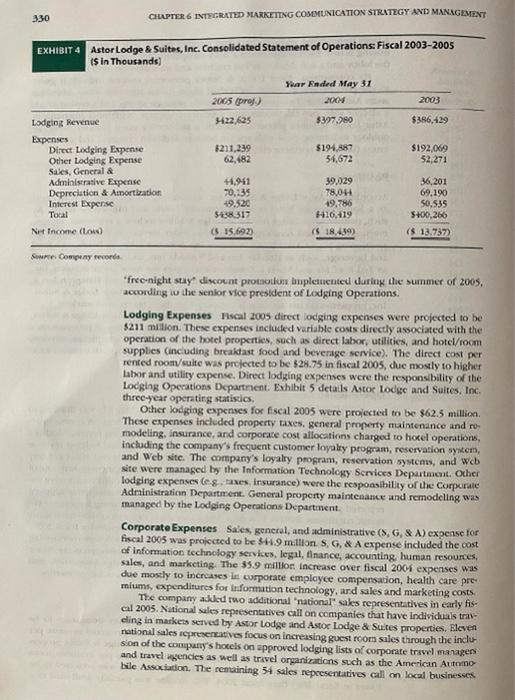
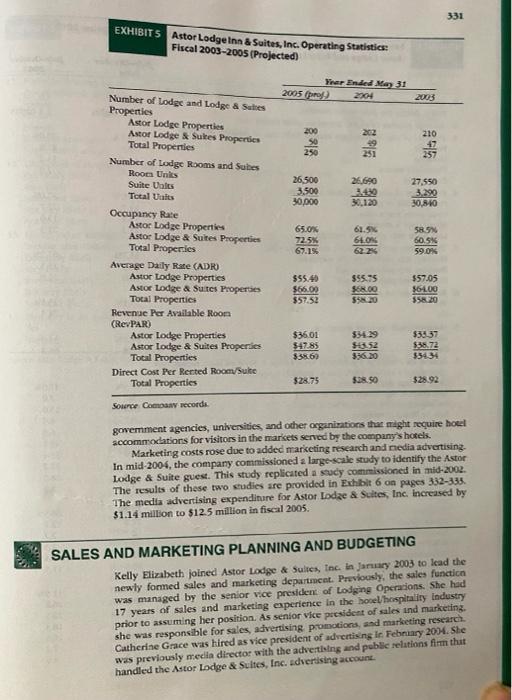
- Write a specific action plan and include at least 5 specific implementation steps to support the answer - quantify the cost and benefits for each of your implementation steps.
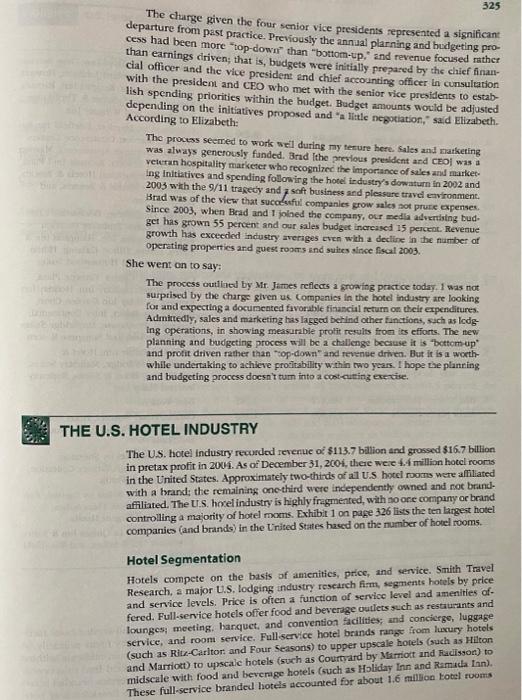
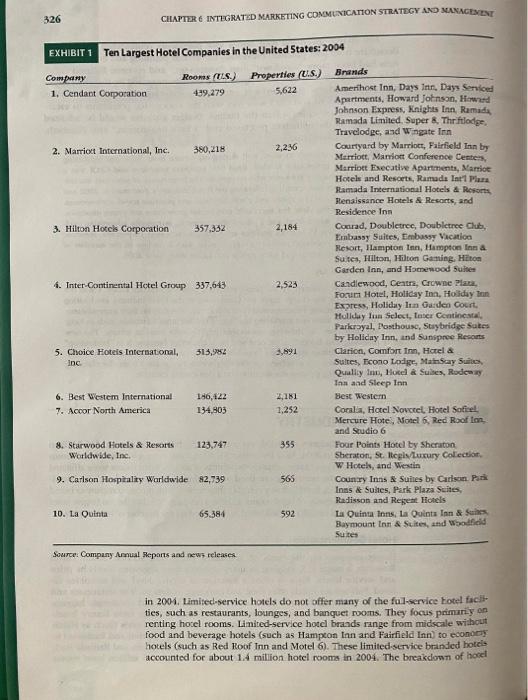
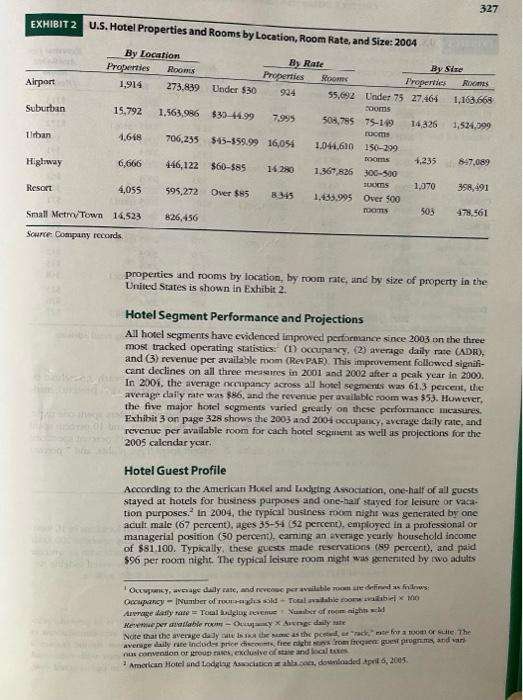
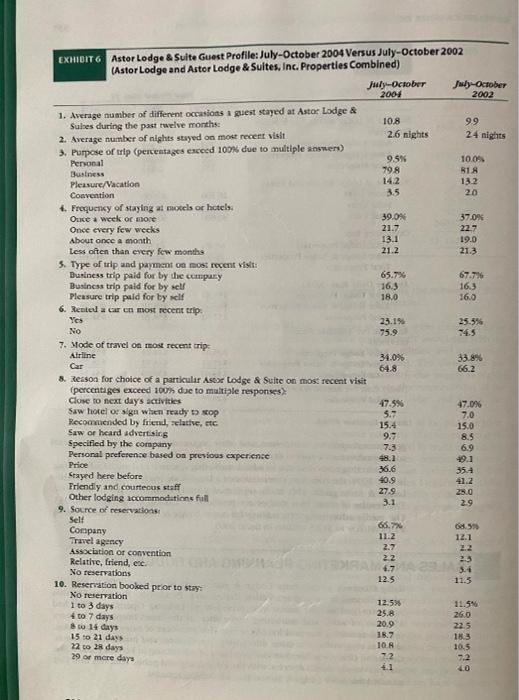
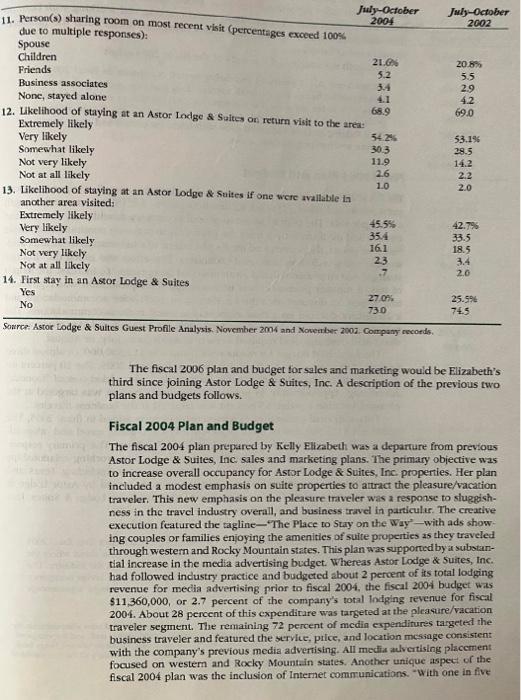
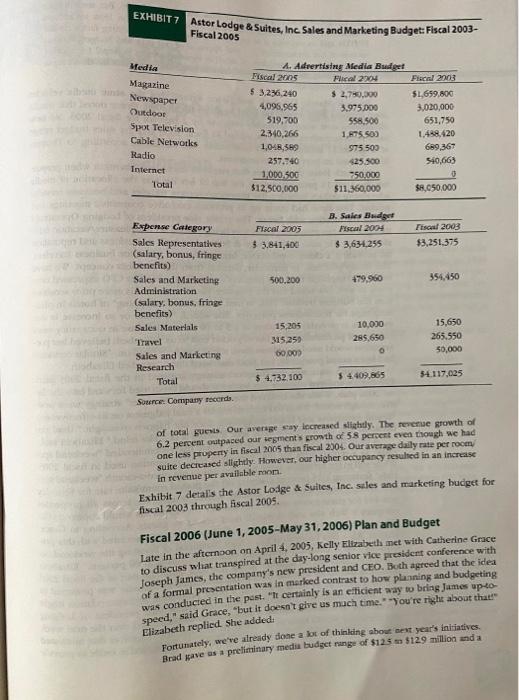
Case Astor Lodge & Suites, Inc. Late in the afternoon on April 4, 2005, Kelly Elizabeth, senior vice president of sales and marketing at Astor Lodge & Suites, Inc., met with Catherine Grace, vice president of advertising. The impromptu meeting followed a day-long senior vice president conference with Joseph James, the company's new president and chief executive officer. James, a seasoned hotel financial executive with 40 years of hotel management experience was appointed the previous week following the sudden resignation of his predecessor. The charge given each of the company's four senior vice presidents was to prepare a one-hour presentation that described (1) his or her initiatives, expenditures, and outcomes for each of the past two fiscal years, and (2) planned initiatives and budgetary needs for fiscal 2006, be- ginning June 1, 2005. James also requested that each presentation provide the motivation for initiatives and expenditures so he could familiarize himself with company operations. Presentations would be made on April 11 to the chair of the board, president and CEO, and chief financial officer following a tour of com- pany properties by James. Fiscal 2005 was projected to be the fifth consecutive unprofitable year for Astor Lodge & Suites, Inc. James announced that his goal for the company was to achieve profitability within two years. Toward this end, he stated that the cumpany would use growth in earnings before interest, taxes, depreciation, and amortization (EBITDA) as a corporate performance measure and a basis for de termining senior management and executive incentive compensation. The use of EBITDA for these purposes had been endorsed by the company's board of direc tors. His overall corporate objective was a 7 percent annual increase in EBITDA over the next two fiscal years. Each senior vice president (lodging operations, corporate administration, information technology services, and sales and market- ing) would be expected to address this objective when presenting their planned initiatives and budgetary needs. In addition, James requested that each senior vice president restate the effect of prior years' initiatives and expenditures from an EBITDA perspective as well as performance measures used previously. The company's vice president and chief accounting officer would supply available financial and operating data to prepare this analysis 325 The charge given the four senior vice presidents represented a significant departure from past practice. Previously the annual plarning and budgeting pro cess had been more top-dowsi" than "bottom-up, and revenue focused mather than earnings ciriven; that is, budgets were initially prepared by the chief finan cial officer and the vice president and chief accounting officer in consultation with the president and CEO who met with the senior vice presidents to estab lish spending priorities within the budget. Budget amounts would be adjusted depending on the initiatives proposed and a little negotiation," said Elizabeth According to Elizabeth: The process seemed to work well during my tesure here. Sales and marketing was always generously fanded. Brad (the previous president and CEO was a veteran hospitality marketer who recognized the importance of sales and market Ing Initiatives and spending following the hotel industry's diowaturn in 2002 and 2003 with the 9/11 tragedy and soft business and pleasure trave environment. Brad was of the view that succesful companies prow sales sot prune expenses Since 2003, when Bead and I joined the company, our media advertising tud- get has grown 55 percent and our sales budget increased 15 percent. Revenue growth has exceeded industry averiges even with a decline in the number of operating properties and guest rooms and suites since fiscal 2003. She went on to say: The process outlined by Mr. James reflects a growing practice today. I was not surprised by the charge given us Companies in the hotel industry are looking for and expecting a documented favorable financial return on their expenditures. Admittedly, sales and marketing has lagged behind other fanctions, such as lodg- ing operations, in showing measurable protit results from its efforts. The new planning and budgeting process will be a challenge because it is bottom up and profit driven rather than top-down and revenue drives. But it is a worth while undertaking to achieve profitability within two years. I hope the planning and budgeting process doesn't turn into a cost-cutting exercise. THE U.S. HOTEL INDUSTRY The U.S. hotel Industry recorded revenue of $113.7 billion and grossed $16.7 billion in pretax profit in 2001. As of December 31, 2001, there were 1.4 million hotel rooms in the United States. Approximately two-thirds of all U.S hotel rooms were affiliated with a brand: the remaining one-third were independently owned and not brand- affiliated. The U.S. hotel industry is highly fragmented, with no one company or brand controlling a majority of hotel moms. Exhibit 1 on page 326 lists the ten largest hotel companies (and brands in the United States hased on the number of hotel rooms. Hotel Segmentation Hotels compete on the basis of amenities, price, and service. Smith Travel Research, a major LilS. lodging industry research fim, segments hotels by price and service levels. Price is often a function of service level and amenities of fered. Full-service hotels offer food and beverage outlets such as restaurants and lounges, meeting, barquet, and convention facilities, and concierge, luggage service, and room service. Full service hotel brands range from luxury hotels (such as Ritz-Carltor and Four Seasons) to upper upscale hotels (such as Hilton and Marriott) to upscale hotels (such as Courtyard by Marriott and Radisson) to midscale with food and beverage hotels (such as Holiday Inn and Ramada Ian). These full-service branded hotels accounted for about 1.6 million botel rooms 326 CHAPTER & INTEGRATED MARKETING COMMUNICATION STRATEGY AND MANAGEMENT EXHIBIT 1 Ten Largest Hotel Companies in the United States: 2004 Company 1. Cendant Corporation Rooms (LS.) 439.279 Properties (L.S.) 5.622 2. Marriott International, Inc. 380,218 2.2.16 3. Hilton Hotels Corporation 357,332 2,184 4. Inter-Continental Hotel Group 337.643 2,523 Brands Amerihost Inn, Days Inn, Days Serviced Apartments, Howard Johnson, Howard Johnson Express, Knights Inn Ramada Ramada Limited. Super & Thriftlodge. Travelodge, and Wingate In Courtyard by Marriot, Fairfield Inn by Marriott, Marriott Conference Center, Marriott Execative Apartments, Mario Hotels and Resorts, Ramads Int'l Plus Ramada International Hotels & Resorts Renaissance Hotels & Resorts, and Residence Inn Conrad, Doubletree, Doubletree Club Embassy Suites, Embassy Vacation Resort, Hampton Inn, Hampton Inn & Suites, Hilton, Hilton Gaming. Hitom Garden Inn, and Homewood Suites Candlewood, Centra, Crowne Plaza Fourt Hotel, Holiday Inn, Holiday Inn Express, Holiday Inn Orden Court Holiday Inn Select Cater Continental Parirayal, osthouse, Staybridge Sutes by Holiday Inn, and Sunspree Resorts Clarion, Comfort Inn, Hotel & Suites, Econo Lodge, Main Say Suites Quality Inn, Hotel & Suites, Rodeway Inn and Sleep Inn Best Western Corala, Hotel Novotel, Hotel Sofitel Mercure Hotel, Notel 6, Red Roofton and Studio 6 Four Points Hotel by Sheraton Sheraton, St. Regis Luxury Collection, W Hotels, and Westin Country Inn & Suites by Carlson Pak Inns & Suites, Park Plaza Suites Radisson and Regent Hotels La Quinta Inns, La Quinta Inn & Suites Baymount Inn & Suites, and wodid Suites 313,582 3,891 5. Choice Hotels International, Inc 6. Best Westem International 7. Accor North America 186,622 134,803 2,181 7,252 8. Starwood Hotels & Resorts Worldwide, Inc. 123.747 355 9. Carlson Hospitality Worldwide 82,739 565 10. La Quinta 65,384 592 Source: Company Annual Reports and new releases in 2001. Limited service hotels do not offer many of the full service Hotel facit ties, such as restaurants, lounges, and banquet rooms. They focus primary on renting hotel rooms. Limited-service hotel brands range from midscale without food and beverage hotels (such as Hampton Inn and Fairfield Inn to economy hotels (such as Red Roof Inn and Motel 6). These limited service branded hotels accounted for about 1 million hotel rooms in 2004. The breakdown of hoel 327 EXHIBIT 2 U.S. Hotel Properties and Rooms by Location, Room Rate, and Size: 2004 By Location By Rate Properties By Sime Rooms Properties Properties Roms Airport 1,914 273.839 Under $30 924 55,692 Under 75 27464 1.163.668 sooms Suburban 19,792 1.563,986 $39-44.99 7.995 508,755 75-100 14326 1,524,099 rums Urban 1,648 706,235 $15-359.99 16,054 1.041,610 150-299 Docs 4,235 847,089 Highway 6,666 446,122 $60-85 14.280 1.567 836 300-500 TUMS 1,070 398, 491 Resort 4,055 595,272 Over $85 8345 1.435.995 Over 500 mams 478.561 Small Metre Town 14,523 826,456 503 Source Company records properties and rooms by location, by room rate, and by size of property in the United States is shown in Exhibit 2 Hotel Segment Performance and Projections All hotel segments have evidenced improved performance since 2003 on the three most tracked operating statistics (1) occupancy, (2) average daily rate (ADR). and (3) revenue per available mom (Rev PAR). This improvement followed signifi- cant declines on all three measures in 2001 and 2002 after a peak year in 2000 In 2001, the average occupancy across all hotel segments was 61.3 percent, the average daily rate was $86, and the revenue per available room was $53. However, the five major hotel segments varied greatly on these performance measures. Exhibit 3 on page 328 shows the 2003 and 2001 occupancy, average daily rate, and revenue per available room for cach hotel segment as well as projections for the 2005 calendar year. Hotel Guest Profile According to the American Hotel and Lodging Association, one-half of all guests stayed at hotels for business purposes and one-half stayed for leisure or vaca tion purposes. In 2004, the typical business room night was generated by one adult male (67 percent), ages 35-54 52 percent), employed in a professional or managerial position (50 percent), earning an average yearly household income of $81.100. Typically, these guests made reservations (89 percent), and paid 596 per room night. The typical leisure room night was generated by two adults OURY, werage daily case, and rece pravite om det finns Opancy - Number of the old - Taller MO Arrage daty rate= Tow budging av or rishis all Rene Perlable - OLX ang daily mail Note that the average day it is the pract for a room of Site The Average daily nite include price disc free night wrote in guest programs and an i convention of group exclusive ose and locales American Hotel and Lodi Association on downloaded April 6, 2005 328 CHAPTER 6 INTEGRATED MARKETING COMINICARON STRATEGY AND MANAGEMENT EXHIBIT3 U.S. Hotel Operating Statistics by Hotel Segments Historical Data and Projection Hulel Segment Luxury Upper Scale Calendar Year 2003 2004 2005 (proj.) 2003 2004 2005 (proj) 2003 2004 2005 (proj.) 2003 2004 2005 (proj) 2003 2004 2005 (proj) 2003 2004 2005 (proj.) OCY (Percent) 66.6% 68.1% 69.9% 66.3% 69.1% 70.99 66.1% 69.2% 70.5% 55.2% 5735 58.456 61.9% 64.15 65.4% 55.1% 51.5% 55.3% Upscale Arenage Daily Rate (ADR) $221 $232 5245 5127 $132 $139 593 595 $101 $72 $74 $75 $69 Calendar Year 2003 2004 2005 (proj) 2003 2004 2005 (pro) 2003 2004 2005 (pro) 2003 2004 2005 (pro) 2005 2001 2005 (pro) 2005 2004 2005 (pro Revente per Available Room (Rer PAR) $113 $158 $172 384 591 $98 $62 567 $71 $40 5-12 $14 $42 $45 SE $25 526 Calendar Year 2003 2004 2005 (proj) 2003 2004 2005 (proj) 2003 2004 2005 (proj.) 2003 2004 2005 (proj 2003 2001 2005 proj) 2003 2004 2005 proj) Miscale with Food and Beverage Midscale without Food and Beverage $71 $73 $18 $49 Economy $50 Source: To predsed on information provided in 2005 animale uport, Imat Sung Retail Advisory Services. 2005 (51 percent), ages 35-54 (45 percent), eaming an average yearly household in- come of $72,600. The typical leisure traveler traveled by auto (74 percent), made a reservation (90 percent), and paid $89 per room night. For a hotel stay in 2004. 39 percent of all business travelers spent one night, 24 percent spent two nights, 27 percent spent three nights, and 10 percent spent four or more nights of leisure travelers staying in a hotel, 45 percent spent one night, 28 percent spent two nlgtus, 20 percent spent three nights, and 7 percent spent four or more night ASTOR LODGE & SUITES, INC. Astor Lodge & Suites, Inc. is a 250-property hotel chain with locations in 10 west- ern and Rocky Mountain states. Formed in 1979, the company operates 200 Astor Lodge properties and 50 Astor Lodge & Suites properties, each with an average of 120 individual guest room or suite units. The company projected lodging rev: enues of $422.6 million for fiscal 2005 and a net loss of $15.7 milion Service Mission The corporate service mission of Astor Lodge & Suites, Inc. is to provide prin cipally business travelers with clean and comfortable guest accommodations in convenient locations at reasonable prices, Astor Lodge guest rooms feature double ur king-size bed; a cable television; a dataport telephone with voice mail and free local calls a well-ti desk and wooden chair with an upholstered seat; 329 a large upholstered recliner chair, and a coffee maker, hair dryer and iron and ironing board. Each Lodge offers a daily complimentary continental breakfast in the lobby and a soft drink vending machine and ice maker on each floor By comparison Astor Lodge & Suites properties contain individual guest rooms plus two-room suites. Individual guest rooms have the same amenities as an Astor Lodge. Two-room suites provide separate sitting and sleeping areas, a sleeper sofa, two televisions, and a small refrigerator. Additional amenities in Astor Lodge & Suites properties include a self-service guest laundry room, an outdoor swimming pool with spa (in warmer southem climates) and an indoor sauna (in cooler northern climates). Positioning According to Astor Lodge & Suites, Inc. executives, the company is positioned as a limited service hotel between economy hotels and full-service hotels. As such, neither Astor Lodge nor Astor Lodge & Suites include a restaurant, lounge, meeting rooms and concierge, luggage, or room service on the property. This positioning places Astor Lodge & Suites, Inc. between midscale hotels with food and beverage, such as Holiday Inn and Ramada Inn, and economy hotels such as Red Roof Inn and Motel 6. Company executives see Astor Lodge & Suites, Inc. positioned against Fairfield Inn by Marriott, Hampton Inn and Hampton Inn & Suites by Hilton, and La Quinta Inn & Suites, even though Astor Lodge & Suites, Inc. properties do not necessarily compete with these hotels in all markets. The company's service mission and positioning directs Astor Lodge & Suites, Inc, site selection decisions. The company locates its properties on premium sites on major highways close to suburban industrial and office complexes, airports, and large regional shopping centers for the most purt. Urban, downtown loca- tions have been avoided. Operations As Astor Lodge & Suites, Inc. fiscal 2005 year (year-end, May 31) was drawing to a close, its senior executives recognized that the company was on course to re- cord its third consecutive fiscal year of rising revenue following revenue declines in fiscal 2001 and fiscal 2002. The company's projected annual lodging revenue growth of 7.4 percent for fiscal 2005 was slightly below the overall hotel industry average of 7.6 percent, but higher than the limited-service segment growth rate of 5.8 percent. However, Astor Lodge & Suites, Inc posted its third consecutive an- nual net loss while the hotel Industry as a whole and the limited service segment reported profitable operations over the past three years following improved eco- nomic conditions. Exhibition page 390 shows the company's consolidated state- ment of operations for fiscal 2003 and 2004, and projected results for fiscal 2005 During fiscal 2005, Astor Lodge & Suites, Inc. closed two underperforming Astor Lodge properties and opened one Astor Lodge & Suites property. Since 2003, the company closed 12 underperforming Astor Lodge properties, and opened two Astor Lodge properties and three Astor Lodge & Sultes properties. Lodging Statistics Astor Lodge & Suites, Inc. projected consolidated company occupancy to be 67.1 percent, with an average daily rate of $57.52. The projected revenue per available room would be $38.60. Astor Lodge and Astor Lodge & Suites proper ties each showed Improvement in occupancy and revenue per available room over fiscal 2004. However, the avcrage daily rate for each was projected to be lower in fiscal 2005 than fiscal 2004. This decline was partially attributed to a 330 CHAPTER 6 INTEGRATED MARKETING COMMUNICATION STRATEGY AND MANAGEMENT EXHIBIT 4 Astor Lodge & Suites, Inc. Consolidated Statement of Operations: Fiscal 2003-2005 tS in Thousands) Year Ended May 31 2005 proj 2003 $397080 $386,129 $211,239 62,182 $194,887 54,672 $192,009 52,271 Lodging Revenue Expenses Direct Lodging Expense Other Lodging Expense Sales, General & Administrative Expense Depreciation & Amortization Interest Expense Tocal 41.941 70,135 19.520 5438317 (5 15.692) 39,029 78.04 19,786 116.419 (6 18.439) 36,201 69,190 50.535 $400,266 ($ 13.757) Net Income (Lowo Sur Company records 'free-night stay discount promotion implemented during the summer of 2005, according to the senior vice president of Lodging Operations. Lodging Expenses Fiscal 2005 direct lodging expenses were projected to be $211 miilion. These expenses included variable costs directly associated with the operation of the hotel properties, such as direct labor, utilities, and hotel/room supplies (including breakdast food and beverage service). The direct cost per rented room/suite was projected to be $28.75 in fiscal 2005, due mostly to higher Labor and utility expense. Direct lodging expenses were the responsibility of the Lodging Operations Department. Exhibit 5 details Astor Lodge and Suites, Inc. three-year operating statistics, Other lodging expenses for fiscal 2005 were projected to be $62.5 million These expenses included property taxes, general property maintenance and re- modeling, insurance, and corporate cost allocations cha to hocel operations, including the company's frequent customer loyalty program, reservation system, and Web site. The company's loyalty program, reservation systems, and web site were managed by the Information Technology Services Department. Other lodging expenses leg, taxes. Insurance) were the responsibility of the Corporate Administration Department. General property maintenance and remodeling was managed by the Lodging Operations Department Corporate Expenses Sales, general, and administrative (S, G, & A) expense for fiscal 2005 was projected to be $11.9 million S, G, & A expense induded the cost of information technology services, legal, finance, accounting, human resources, sales, and marketing. The $59 million Increase over fiscal 2001 expenses was due mostly to increases in corporate employee compensation, health care pre miums, expenditures for information technology, and sales and marketing costs The company added two additional national sales representatives in early fis- cal 2005. National sales representatives call on companies that have individuals trav cling in markets served by Astor Lodge and Astor Lodge & Suites properties. Eleven national sales representatives focus on increasing guest room sales through the inclus sion of the company's hotels on approved lodging lists of corporate travel managers and travel wgencies as well as travel organizations such as the American Automo bile Association. The remaining 54 sales representatives call on local businesses 331 2003 210 257 EXHIBITS Astor Lodge Inn & Suites, Inc. Operating Statistics: Fiscal 2003-2005 (Projected) har Ended Ma 31 20052 2204 Number of Lodge and Lodge & Sales Properties Astor Lodge Properties 200 Astor Lodge & Suites Properties Total Properties so 49 250 251 Number of Lodge Rooms and Subes Rooma Uns 26,500 26.690 Suite Vales 3,500 Total Units 30,000 30,120 Occupancy Rate Astor Lodge Properties 65.0% 61.5X Astor Lodge & Suites Properties 72.5% 61.ON Total Properties 67.15 622 Average Daily Rate (ADRO Astor Lodge Properties $55.40 $55.95 Astor Lodge & Suites Properties $66.00 $50.00 Total Properties $57.52 Revenge Per Available Room (Rev PAR) Astor Lodge Properties $36.01 $34.29 Astor Lodge & Suites Properties $47.85 Total Properties 35860 Direct Cost Per Rented Room/Suite Total Properties $28.75 $38.50 27,550 3.290 30,840 58.9N 60.5% 59.0% $57.05 56100 $58.20 $33.37 $38.72 5544 $28.92 Source Com recorda gowemment agencies, universities, and other organizations that might require hotel accommodations for visitors in the markets served by the company's hotels Marketing costs rose due to added marketing research and media advertising In mid-2006, the company commissioned a large-scale study to identify the Astor Lodge & Suite guest. This study replicated a study commissioned in mid-2002 The results of these two studies are provided in Exhibit 6 on pages 332-33%. The media advertising expenditure for Astor Lodze & Suites, Inc. Increased by $1.14 million to $12.5 million in fiscal 2005. SALES AND MARKETING PLANNING AND BUDGETING Kelly Elizabeth joined Astor Lodge & Suites, Inc. in January 2003 to lead the newly formed sales and marketing department. Previously, the sales function was managed by the senior vice president of Lodging Operations. She had 17 years of sales and marketing experience in the honel hospitality Industry prior to assuming her position. As senior vice president of sales and marketing, she was responsible for sales, advertising promotions, and marketing research. Catherine Grace was hired as vice president of advertising In February 2004. She was previously media director with the advertising and public relations firm that handled the Astor Lodge & Suites, Inc. advertising account 24 nights 14.2 EXHIBIT 6 Astor Lodge & Suite Guest Profile: July-October 2004 Versus July-October 2002 (Astor Lodge and Astor Lodge & Suites, Inc. Properties Combined) July-October July-October 2004 2002 1. Average number of different occasions a guest stayed at Astor Lodge & 10.8 99 Sules during the past welve months 2. Average number of nights stayed on most recent visit 26 nights 3. Purpose of trip (percentages exceed 100% due to multiple answers) Personal 9.5% 10.05 79.8 Business 31.8 Pleasure/Vacation 13.2 Convention 3.5 20 4. Frequency of staying al models or hotels Once a week or more 39.0% 37.0% Once every few wecks 21.7 22.7 About once a month 13.1 19.0 Less often than every few months 21.2 21.3 5. Type of trip and payment on most recent visit: Business trip paid for by the company 65.7% 67.7% Business trip paid for by sell 165 16.3 Pleasure trip paid for by self 18.0 16.0 6. Rented a caren most recent trip Yes 23.196 25.554 No 75.9 7. Mode of travel on most recent trip Airline 34.0% 33.8% Car 64.8 66.2 8. Reason for choice of a particular Astor Lodge & Suite on most recent visit (percentages exceed 100h due to multiple responses Close to next day's activities 47.595 Saw hotel of sign when ready to stop 47.0% 5.7 7.0 Recommended by friend, relative, etc. 15.4 15.0 Saw or heard advertising 9.7 8.5 Specified by the company 723 Personal preference based on previous experience 6.9 48.1 19.1 Price 36.6 35.4 Stayed here before 40.9 412 Friendly and courteous staff 27.9 25.0 Other lodging accommodations full 3.1 29 9. Source of reservations Sel! Company 66.7% 6.99 11:2 12.1 Association or convention 2.7 Relative, friend, etc. 22 No reservations 5. 10. Reservation booked prior to stay 12.5 11.5 No reservation 1 to 3 days 12.5% 11.5 400 7 days 25.8 260 o 14 days 20.9 22.5 15 to 21 days 18.7 183 22 o 28 days 10.A 10.5 29 or more days 72 4.1 Travel agency July-October 2002 20.8% 5.5 2.9 4.2 69.0 July-October 11. Person(s) sharing room on most recent visit (percentages exceed 100% 2004 due to multiple responses). Spouse Children 21.6 Friends 5.2 Business associates 3.4 None, stayed alone 4.1 12. Likelihood of staying at an Astor Lodge & Suites on return visit to the area: 68.9 Extremely likely Very likely 54.25 Somewhat likely 30.3 11.9 Not very likely 2.6 Not at all likely 1.0 13. Likelihood of staying at an Astor Lodge & Suites If one were wailable ta another area visited: Extremely likely 45.5% Very likely 354 Somewhat likely 16.1 Not very likely 23 Not at all likely 7 14. First stay in an Astor Lodge & Suites Yes 2707 No 730 Source: Astor Lodge & Suites Guest Profile Analysis. November 2004 and November 2007. Company records. 53.196 28.5 14.2 2.2 2.0 42.79 33.5 18.5 3.4 2.0 25.59 74.5 The fiscal 2006 plan and budget for sales and marketing would be Elizabeth's third since joining Astor Lodge & Suites, Inc. A description of the previous two plans and budgets follows. Fiscal 2004 Plan and Budget The fiscal 2004 plan prepared by Kelly Elizabeth was a departure from previous Astor Lodge & Suites, Inc sales and marketing plans. The primary objective was to increase overall occupancy for Astor Lodge & Suites, Inc. properties. Her plan included a modest emphasis on suite properties to attract the pleasure/vacation traveler. This new emphasis on the pleasure traveler was a response to sluggish- ness in the travel industry overall, and business travel in particular. The creative execution featured the tagline-The Place to stay on the Way-with ads show- ing couples or families enjoying the amenities of suite properties as they traveled through western and Rocky Mountain states. This plan was supported by a substan- tial increase in the media advertising budget. Whereas Astor Lodge & Suites, Inc. had followed industry practice and budgeted about 2 percent of its total lodging revenue for media advertising prior to fiscal 2004, the fiscal 2004 budget was $11,360,000, or 2.7 percent of the company's total lodging revenue for fiscal 2004. About 28 percent of this expenditare was targeted at the pleasure/vacation traveler seginent. The remaining 72 percent of media expenditures targeted the business traveler and featured the service, price, and location message consistent with the company's previous media advertising. All media advertising placement focused on western and Rocky Mountain states. Another unique aspect of the fiscal 2004 plan was the inclusion of Internet communications. With one in five 334 CHAPTER 6 INTEGRATED MARKETING COMMUNICATION STRATEGY AND MANAGEMENT travelers today using the Internet to plan their trips and make reservations, this addition to the media mix was critical,' said Catherine Grace. The fiscal 2004 sales budget Increased to $4.4 million with the addition of two national sales representatives plus added compensation and travel costs Each was given primary responsibility for contacting and working with both of fline and online travel agencies and travel organizations to build the pleasure/ vacation travel business. Elizabeth summarized the results of the fiscal 2001 effort: We achieved our objective of increasing overall occupancy in fiscal 2004. This was important because our overall average daily rate was unchanged. Our prop erties with suites attracted the pleasure/vacation traveler as evidenced by a rise in weekend occupancy for both Astur Lodge and Astor Lodge & Suite properties Total lodging revenue increased even with fewer properties and guest rooms as did our revenue per available room. Fiscal 2005 Plan and Budget The fiscal 2005 plan had three objectives: (1) to increase overall occupancy in both guest rooms and suites, (2) to attract first-time guests, and (3) to increase the length of stay per visit. The plan to increase overall occupancy would carry forward the creative and media initiatives from the prior year to maintain continuity. To attract first time guests, the scope of ad media placement would broaden to indude mid- western states, including Texas and Oklahoma This effort was called the frontier strategy and emphasized brand awareness and acceptance. To increase the length of stay, a summer promotion was implemented. This promotion was equivalent to a 50 percent discount on a third night stay in guest suite accommodations and a 25 percent discount on a third night stay in guest room accommodations. The promotion appeared in electronic and print ads run in April and May along with a direct-mail campaign, and required a reservation for June, July, or August The fiscal 2005 budget for media advertising was $12,500,000, or almost three percent of the company's total lodging revenue for fiscal 2005. The 10 percent in- crease in media expenditures was due exclusively to the added cost of "frontier" advertising. Approximately 35 percent of the media budget was targeted at the pleasure/vacation traveler; 65 percent was targeted at the business traveler. Two additional national sales representatives were added in fiscal 2005. The additional $135,500 cost of these representatives, including travel and other ad. ditional costs, increased the sales budget to $4.7 million. The primary respon- sibility of national sales representatives was to develop working relationships with companies and organizations in midwestern states (including Texas and Oklahoma) that had individuals traveling in markets served by Astor Lodge & Suites, Inc. properties. The intention was to increase Astor Lodge & Suites, Inc brand acceptance with companies. Commenting on the fiscal 2005 plan, Elizabeth said Our occupancy rates for all properties will be 7.9 percent higher than fiscal 2004 occupancy rates based on our year-end projections. We are now shout where the company was in fiscal 2000 prior to the occupancy decline in the industry. The greatest lift came from Astor Lodge & Suites properties. Astor Lodge occupancy increased as well. We increased the percentage of new guests as 1 percerlage the sales budget consists of salaries, fringe benefts, travel allowances, and sales administration for national and local salespeople, district managers, sales support and clerical staff and the vice presi dent of sales. It also includes sales material expenses. For budgeting purposes salaries, fringe bene fits, and travel allowances for the senior vice president of sales and marketing and the vice president of advertising were included in the sales hudget EXHIBIT7 Astor Lodge & Suites, Inc Sales and Marketing Budget: Fiscal 2003- Fiscal 2005 Media Magazine Newspaper Outdoor Spot Television Cable Networks Radio Internet Total 4. Adrertising Media Budget Fiscal 2005 Final 2204 Fiec 2013 $ 3.236.240 $ 2,750,000 51,659.806 4,095.965 3.975.000 3,020,000 519,700 558.500 651,750 2.340,266 1. RT5 600 1.438.420 1,048,589 575 509 689,367 257.540 $25.500 510,665 1,000.500 250.000 $12.500.000 $11,360,000 $8,050,000 Fiscal 2003 Fiscal 2005 $ 3.841,400 B. Sains Budget Fiscal 2001 $3,63.255 $3,251,375 500.200 +79.960 354.450 Expense Category Sales Representatives (salary, bonus, fringe benefits) Sales and Marketing Administration (salary, bonus, fringe benefits) Sales Materials Travel Sales and Marketing Research Total 15,205 315.259 0000D 10.000 285,650 15,650 265.550 50,000 o $ 4.732.100 $4.409,805 54.117,025 Source: Company records. of total guests Our average ray lecreased slightly. The revenue growth of 6.2 percent outpaced our tegments growth of 58 percent even though we had one less property in fiscal 2005 than fiscal 2504. Our average daily rate per room suite decreased slightly. However, our higher occupancy resulted in an increase in revenue per available on Exhibit 7 details the Astor Lodge & Suites, Inc. sales and marketing budget for fiscal 2003 through fiscal 2005. Fiscal 2006 (June 1, 2005-May 31, 2006) Plan and Budget Late in the afternoon on April 4, 2005, Kelly Elizabeth met with Catherine Grace to discuss wliat transpired at the day-long senior vice president conference with Joseph James, the company's new president and CEO. Both agreed that the idea of a formal presentation was in marked contrast to how planning and budgeting was conducted in the past. "It certainly is an efficient way to bring James up to speed," said Grace,"but it doesn't give us much time." "You're right about that Elizabeth replied She added Fortunately, we've already done a lot of thinking about next year's initiatives. Brad gave us a preliminary media budget range of $125 $129 million and a 5 CHAPTER 6 INTEGRATED MARKETING COMMUNICATION STRATEGY AND MANAGEMENT sales budget of $4.95 to $5 million to work with for fiscal 2006. Bus, we will have to make a number of decisions before the April 11 presentation. How we address EBITDA and incorporate it in our presentation will be a deciding factor on the success of our presentation and approval of our plan and budget. Thomas Thomas Klein vke president of sales) is incommunicado in Nepal for another wuch imbing mountains, so we'll have to forge ahead without his direct input for the presentation. In carly March, Elizabeth and Grace agreed that the same media vehicles used in fiscal 2005 would be used again in fiscal 2006. Grace noted that media advertising cost would probably increase by 2 percent for fiscal 2006. No new sales representatives would be added in fiscal 2006 and the sales budget range of 94.85 to $5 million seemed reasonable and workable, according to Thomas Klein, based on previous conversations. Elizabeth listed three issues that required immediate attention when prepar- ing the April 11 presentation. At the top of her list was the allocation of media advertising dollars between the pleasure/vacation traveler and business traveler market. This issue had come up in previous executive committee meetings and during the meeting with James. The senior vice president of Lodging Operations thought that too much emphasis was being placed on the pleasure/vacation trav. cler market. He said: "Astor Lodge & Suites, Inc.built its business and reputation on providing a clean, comfortable, and convenient place for business travelers The family business, in particular, detracts from this business concept. We have received complaints from our frequent business guests. The CFO expressed con cerns as well. She noted that the pleasure/vacation traveler is more price sensitive than the business traveler. This, in turn, led to more "shopping of hotels in plan ning trips for nonbusiness purposes. She added. "A dollar or so increase in our room rate is probably equivalent to a 5 to 10 percent increase in occupancy rates in terms of profitability at no out-of-pocket cost to us." Elizabeth believed her pre sentation would need to address these stated concems head-on. Similar concerns had been raised previously, but Brad dismissed them.' recalled Elizabeth A second Issue was the frontier strategy initiated in the fiscal 2005 plan Elizabeth wondered whether this initiative should be carried forward into the fis. cal 2006 plan. While she believed the results of the frontier" strategy were pol- tive, though mixed, it was too early to render a final judgment on its effectiveness. "Brand awareness and brand acceptance does not happen overnight." Brad un derstood this, but it remains to be seen if James is of a like mind, Elizabeth said. A third issue related to promotions. Grace had recommended "weekend spe- cials as a replacement for the "free-night stay" promotion used in fiscal 2005 While still in the formative state, her idea was to run once a month weekend spe cials featuring a 25 percent discount off the posted om/te rate for Saturday and Sunday night stays. (The average posted "rack rate across all pmpert.es was $62 for guest rooms and $75 for suites. These specials would appear on the company's Web site and in e-mail notifications to guests. According to Grace. "There would be virtually no additional advertising cost associated with this pro- motion. Also, this promotion has a high likelihood of boosting the weekend op cupancy rate at company properties which is hovering at 60 percent. Elizabeth had not yet decided on whether or not this idea would be part of the fiscal 2006 plan. She did know that the direct cost per rented room/suite was projected to rise by 2 percent in fiscal 2006 and a price promotion recommendation might meet some resistance, particularly from the senior vice president of Lodging Operations. The various issues would need to be addressed over the next week and decisions would have to be made. In addition, the objectives that motivated the fiscal 2006 initiatives and budget needed to be identified in order to provide a coherent presentation at the April 11 meeting Case Astor Lodge & Suites, Inc. Late in the afternoon on April 4, 2005, Kelly Elizabeth, senior vice president of sales and marketing at Astor Lodge & Suites, Inc., met with Catherine Grace, vice president of advertising. The impromptu meeting followed a day-long senior vice president conference with Joseph James, the company's new president and chief executive officer. James, a seasoned hotel financial executive with 40 years of hotel management experience was appointed the previous week following the sudden resignation of his predecessor. The charge given each of the company's four senior vice presidents was to prepare a one-hour presentation that described (1) his or her initiatives, expenditures, and outcomes for each of the past two fiscal years, and (2) planned initiatives and budgetary needs for fiscal 2006, be- ginning June 1, 2005. James also requested that each presentation provide the motivation for initiatives and expenditures so he could familiarize himself with company operations. Presentations would be made on April 11 to the chair of the board, president and CEO, and chief financial officer following a tour of com- pany properties by James. Fiscal 2005 was projected to be the fifth consecutive unprofitable year for Astor Lodge & Suites, Inc. James announced that his goal for the company was to achieve profitability within two years. Toward this end, he stated that the cumpany would use growth in earnings before interest, taxes, depreciation, and amortization (EBITDA) as a corporate performance measure and a basis for de termining senior management and executive incentive compensation. The use of EBITDA for these purposes had been endorsed by the company's board of direc tors. His overall corporate objective was a 7 percent annual increase in EBITDA over the next two fiscal years. Each senior vice president (lodging operations, corporate administration, information technology services, and sales and market- ing) would be expected to address this objective when presenting their planned initiatives and budgetary needs. In addition, James requested that each senior vice president restate the effect of prior years' initiatives and expenditures from an EBITDA perspective as well as performance measures used previously. The company's vice president and chief accounting officer would supply available financial and operating data to prepare this analysis 325 The charge given the four senior vice presidents represented a significant departure from past practice. Previously the annual plarning and budgeting pro cess had been more top-dowsi" than "bottom-up, and revenue focused mather than earnings ciriven; that is, budgets were initially prepared by the chief finan cial officer and the vice president and chief accounting officer in consultation with the president and CEO who met with the senior vice presidents to estab lish spending priorities within the budget. Budget amounts would be adjusted depending on the initiatives proposed and a little negotiation," said Elizabeth According to Elizabeth: The process seemed to work well during my tesure here. Sales and marketing was always generously fanded. Brad (the previous president and CEO was a veteran hospitality marketer who recognized the importance of sales and market Ing Initiatives and spending following the hotel industry's diowaturn in 2002 and 2003 with the 9/11 tragedy and soft business and pleasure trave environment. Brad was of the view that succesful companies prow sales sot prune expenses Since 2003, when Bead and I joined the company, our media advertising tud- get has grown 55 percent and our sales budget increased 15 percent. Revenue growth has exceeded industry averiges even with a decline in the number of operating properties and guest rooms and suites since fiscal 2003. She went on to say: The process outlined by Mr. James reflects a growing practice today. I was not surprised by the charge given us Companies in the hotel industry are looking for and expecting a documented favorable financial return on their expenditures. Admittedly, sales and marketing has lagged behind other fanctions, such as lodg- ing operations, in showing measurable protit results from its efforts. The new planning and budgeting process will be a challenge because it is bottom up and profit driven rather than top-down and revenue drives. But it is a worth while undertaking to achieve profitability within two years. I hope the planning and budgeting process doesn't turn into a cost-cutting exercise. THE U.S. HOTEL INDUSTRY The U.S. hotel Industry recorded revenue of $113.7 billion and grossed $16.7 billion in pretax profit in 2001. As of December 31, 2001, there were 1.4 million hotel rooms in the United States. Approximately two-thirds of all U.S hotel rooms were affiliated with a brand: the remaining one-third were independently owned and not brand- affiliated. The U.S. hotel industry is highly fragmented, with no one company or brand controlling a majority of hotel moms. Exhibit 1 on page 326 lists the ten largest hotel companies (and brands in the United States hased on the number of hotel rooms. Hotel Segmentation Hotels compete on the basis of amenities, price, and service. Smith Travel Research, a major LilS. lodging industry research fim, segments hotels by price and service levels. Price is often a function of service level and amenities of fered. Full-service hotels offer food and beverage outlets such as restaurants and lounges, meeting, barquet, and convention facilities, and concierge, luggage service, and room service. Full service hotel brands range from luxury hotels (such as Ritz-Carltor and Four Seasons) to upper upscale hotels (such as Hilton and Marriott) to upscale hotels (such as Courtyard by Marriott and Radisson) to midscale with food and beverage hotels (such as Holiday Inn and Ramada Ian). These full-service branded hotels accounted for about 1.6 million botel rooms 326 CHAPTER & INTEGRATED MARKETING COMMUNICATION STRATEGY AND MANAGEMENT EXHIBIT 1 Ten Largest Hotel Companies in the United States: 2004 Company 1. Cendant Corporation Rooms (LS.) 439.279 Properties (L.S.) 5.622 2. Marriott International, Inc. 380,218 2.2.16 3. Hilton Hotels Corporation 357,332 2,184 4. Inter-Continental Hotel Group 337.643 2,523 Brands Amerihost Inn, Days Inn, Days Serviced Apartments, Howard Johnson, Howard Johnson Express, Knights Inn Ramada Ramada Limited. Super & Thriftlodge. Travelodge, and Wingate In Courtyard by Marriot, Fairfield Inn by Marriott, Marriott Conference Center, Marriott Execative Apartments, Mario Hotels and Resorts, Ramads Int'l Plus Ramada International Hotels & Resorts Renaissance Hotels & Resorts, and Residence Inn Conrad, Doubletree, Doubletree Club Embassy Suites, Embassy Vacation Resort, Hampton Inn, Hampton Inn & Suites, Hilton, Hilton Gaming. Hitom Garden Inn, and Homewood Suites Candlewood, Centra, Crowne Plaza Fourt Hotel, Holiday Inn, Holiday Inn Express, Holiday Inn Orden Court Holiday Inn Select Cater Continental Parirayal, osthouse, Staybridge Sutes by Holiday Inn, and Sunspree Resorts Clarion, Comfort Inn, Hotel & Suites, Econo Lodge, Main Say Suites Quality Inn, Hotel & Suites, Rodeway Inn and Sleep Inn Best Western Corala, Hotel Novotel, Hotel Sofitel Mercure Hotel, Notel 6, Red Roofton and Studio 6 Four Points Hotel by Sheraton Sheraton, St. Regis Luxury Collection, W Hotels, and Westin Country Inn & Suites by Carlson Pak Inns & Suites, Park Plaza Suites Radisson and Regent Hotels La Quinta Inns, La Quinta Inn & Suites Baymount Inn & Suites, and wodid Suites 313,582 3,891 5. Choice Hotels International, Inc 6. Best Westem International 7. Accor North America 186,622 134,803 2,181 7,252 8. Starwood Hotels & Resorts Worldwide, Inc. 123.747 355 9. Carlson Hospitality Worldwide 82,739 565 10. La Quinta 65,384 592 Source: Company Annual Reports and new releases in 2001. Limited service hotels do not offer many of the full service Hotel facit ties, such as restaurants, lounges, and banquet rooms. They focus primary on renting hotel rooms. Limited-service hotel brands range from midscale without food and beverage hotels (such as Hampton Inn and Fairfield Inn to economy hotels (such as Red Roof Inn and Motel 6). These limited service branded hotels accounted for about 1 million hotel rooms in 2004. The breakdown of hoel 327 EXHIBIT 2 U.S. Hotel Properties and Rooms by Location, Room Rate, and Size: 2004 By Location By Rate Properties By Sime Rooms Properties Properties Roms Airport 1,914 273.839 Under $30 924 55,692 Under 75 27464 1.163.668 sooms Suburban 19,792 1.563,986 $39-44.99 7.995 508,755 75-100 14326 1,524,099 rums Urban 1,648 706,235 $15-359.99 16,054 1.041,610 150-299 Docs 4,235 847,089 Highway 6,666 446,122 $60-85 14.280 1.567 836 300-500 TUMS 1,070 398, 491 Resort 4,055 595,272 Over $85 8345 1.435.995 Over 500 mams 478.561 Small Metre Town 14,523 826,456 503 Source Company records properties and rooms by location, by room rate, and by size of property in the United States is shown in Exhibit 2 Hotel Segment Performance and Projections All hotel segments have evidenced improved performance since 2003 on the three most tracked operating statistics (1) occupancy, (2) average daily rate (ADR). and (3) revenue per available mom (Rev PAR). This improvement followed signifi- cant declines on all three measures in 2001 and 2002 after a peak year in 2000 In 2001, the average occupancy across all hotel segments was 61.3 percent, the average daily rate was $86, and the revenue per available room was $53. However, the five major hotel segments varied greatly on these performance measures. Exhibit 3 on page 328 shows the 2003 and 2001 occupancy, average daily rate, and revenue per available room for cach hotel segment as well as projections for the 2005 calendar year. Hotel Guest Profile According to the American Hotel and Lodging Association, one-half of all guests stayed at hotels for business purposes and one-half stayed for leisure or vaca tion purposes. In 2004, the typical business room night was generated by one adult male (67 percent), ages 35-54 52 percent), employed in a professional or managerial position (50 percent), earning an average yearly household income of $81.100. Typically, these guests made reservations (89 percent), and paid 596 per room night. The typical leisure room night was generated by two adults OURY, werage daily case, and rece pravite om det finns Opancy - Number of the old - Taller MO Arrage daty rate= Tow budging av or rishis all Rene Perlable - OLX ang daily mail Note that the average day it is the pract for a room of Site The Average daily nite include price disc free night wrote in guest programs and an i convention of group exclusive ose and locales American Hotel and Lodi Association on downloaded April 6, 2005 328 CHAPTER 6 INTEGRATED MARKETING COMINICARON STRATEGY AND MANAGEMENT EXHIBIT3 U.S. Hotel Operating Statistics by Hotel Segments Historical Data and Projection Hulel Segment Luxury Upper Scale Calendar Year 2003 2004 2005 (proj.) 2003 2004 2005 (proj) 2003 2004 2005 (proj.) 2003 2004 2005 (proj) 2003 2004 2005 (proj) 2003 2004 2005 (proj.) OCY (Percent) 66.6% 68.1% 69.9% 66.3% 69.1% 70.99 66.1% 69.2% 70.5% 55.2% 5735 58.456 61.9% 64.15 65.4% 55.1% 51.5% 55.3% Upscale Arenage Daily Rate (ADR) $221 $232 5245 5127 $132 $139 593 595 $101 $72 $74 $75 $69 Calendar Year 2003 2004 2005 (proj) 2003 2004 2005 (pro) 2003 2004 2005 (pro) 2003 2004 2005 (pro) 2005 2001 2005 (pro) 2005 2004 2005 (pro Revente per Available Room (Rer PAR) $113 $158 $172 384 591 $98 $62 567 $71 $40 5-12 $14 $42 $45 SE $25 526 Calendar Year 2003 2004 2005 (proj) 2003 2004 2005 (proj) 2003 2004 2005 (proj.) 2003 2004 2005 (proj 2003 2001 2005 proj) 2003 2004 2005 proj) Miscale with Food and Beverage Midscale without Food and Beverage $71 $73 $18 $49 Economy $50 Source: To predsed on information provided in 2005 animale uport, Imat Sung Retail Advisory Services. 2005 (51 percent), ages 35-54 (45 percent), eaming an average yearly household in- come of $72,600. The typical leisure traveler traveled by auto (74 percent), made a reservation (90 percent), and paid $89 per room night. For a hotel stay in 2004. 39 percent of all business travelers spent one night, 24 percent spent two nights, 27 percent spent three nights, and 10 percent spent four or more nights of leisure travelers staying in a hotel, 45 percent spent one night, 28 percent spent two nlgtus, 20 percent spent three nights, and 7 percent spent four or more night ASTOR LODGE & SUITES, INC. Astor Lodge & Suites, Inc. is a 250-property hotel chain with locations in 10 west- ern and Rocky Mountain states. Formed in 1979, the company operates 200 Astor Lodge properties and 50 Astor Lodge & Suites properties, each with an average of 120 individual guest room or suite units. The company projected lodging rev: enues of $422.6 million for fiscal 2005 and a net loss of $15.7 milion Service Mission The corporate service mission of Astor Lodge & Suites, Inc. is to provide prin cipally business travelers with clean and comfortable guest accommodations in convenient locations at reasonable prices, Astor Lodge guest rooms feature double ur king-size bed; a cable television; a dataport telephone with voice mail and free local calls a well-ti desk and wooden chair with an upholstered seat; 329 a large upholstered recliner chair, and a coffee maker, hair dryer and iron and ironing board. Each Lodge offers a daily complimentary continental breakfast in the lobby and a soft drink vending machine and ice maker on each floor By comparison Astor Lodge & Suites properties contain individual guest rooms plus two-room suites. Individual guest rooms have the same amenities as an Astor Lodge. Two-room suites provide separate sitting and sleeping areas, a sleeper sofa, two televisions, and a small refrigerator. Additional amenities in Astor Lodge & Suites properties include a self-service guest laundry room, an outdoor swimming pool with spa (in warmer southem climates) and an indoor sauna (in cooler northern climates). Positioning According to Astor Lodge & Suites, Inc. executives, the company is positioned as a limited service hotel between economy hotels and full-service hotels. As such, neither Astor Lodge nor Astor Lodge & Suites include a restaurant, lounge, meeting rooms and concierge, luggage, or room service on the property. This positioning places Astor Lodge & Suites, Inc. between midscale hotels with food and beverage, such as Holiday Inn and Ramada Inn, and economy hotels such as Red Roof Inn and Motel 6. Company executives see Astor Lodge & Suites, Inc. positioned against Fairfield Inn by Marriott, Hampton Inn and Hampton Inn & Suites by Hilton, and La Quinta Inn & Suites, even though Astor Lodge & Suites, Inc. properties do not necessarily compete with these hotels in all markets. The company's service mission and positioning directs Astor Lodge & Suites, Inc, site selection decisions. The company locates its properties on premium sites on major highways close to suburban industrial and office complexes, airports, and large regional shopping centers for the most purt. Urban, downtown loca- tions have been avoided. Operations As Astor Lodge & Suites, Inc. fiscal 2005 year (year-end, May 31) was drawing to a close, its senior executives recognized that the company was on course to re- cord its third consecutive fiscal year of rising revenue following revenue declines in fiscal 2001 and fiscal 2002. The company's projected annual lodging revenue growth of 7.4 percent for fiscal 2005 was slightly below the overall hotel industry average of 7.6 percent, but higher than the limited-service segment growth rate of 5.8 percent. However, Astor Lodge & Suites, Inc posted its third consecutive an- nual net loss while the hotel Industry as a whole and the limited service segment reported profitable operations over the past three years following improved eco- nomic conditions. Exhibition page 390 shows the company's consolidated state- ment of operations for fiscal 2003 and 2004, and projected results for fiscal 2005 During fiscal 2005, Astor Lodge & Suites, Inc. closed two underperforming Astor Lodge properties and opened one Astor Lodge & Suites property. Since 2003, the company closed 12 underperforming Astor Lodge properties, and opened two Astor Lodge properties and three Astor Lodge & Sultes properties. Lodging Statistics Astor Lodge & Suites, Inc. projected consolidated company occupancy to be 67.1 percent, with an average daily rate of $57.52. The projected revenue per available room would be $38.60. Astor Lodge and Astor Lodge & Suites proper ties each showed Improvement in occupancy and revenue per available room over fiscal 2004. However, the avcrage daily rate for each was projected to be lower in fiscal 2005 than fiscal 2004. This decline was partially attributed to a 330 CHAPTER 6 INTEGRATED MARKETING COMMUNICATION STRATEGY AND MANAGEMENT EXHIBIT 4 Astor Lodge & Suites, Inc. Consolidated Statement of Operations: Fiscal 2003-2005 tS in Thousands) Year Ended May 31 2005 proj 2003 $397080 $386,129 $211,239 62,182 $194,887 54,672 $192,009 52,271 Lodging Revenue Expenses Direct Lodging Expense Other Lodging Expense Sales, General & Administrative Expense Depreciation & Amortization Interest Expense Tocal 41.941 70,135 19.520 5438317 (5 15.692) 39,029 78.04 19,786 116.419 (6 18.439) 36,201 69,190 50.535 $400,266 ($ 13.757) Net Income (Lowo Sur Company records 'free-night stay discount promotion implemented during the summer of 2005, according to the senior vice president of Lodging Operations. Lodging Expenses Fiscal 2005 direct lodging expenses were projected to be $211 miilion. These expenses included variable costs directly associated with the operation of the hotel properties, such as direct labor, utilities, and hotel/room supplies (including breakdast food and beverage service). The direct cost per rented room/suite was projected to be $28.75 in fiscal 2005, due mostly to higher Labor and utility expense. Direct lodging expenses were the responsibility of the Lodging Operations Department. Exhibit 5 details Astor Lodge and Suites, Inc. three-year operating statistics, Other lodging expenses for fiscal 2005 were projected to be $62.5 million These expenses included property taxes, general property maintenance and re- modeling, insurance, and corporate cost allocations cha to hocel operations, including the company's frequent customer loyalty program, reservation system, and Web site. The company's loyalty program, reservation systems, and web site were managed by the Information Technology Services Department. Other lodging expenses leg, taxes. Insurance) were the responsibility of the Corporate Administration Department. General property maintenance and remodeling was managed by the Lodging Operations Department Corporate Expenses Sales, general, and administrative (S, G, & A) expense for fiscal 2005 was projected to be $11.9 million S, G, & A expense induded the cost of information technology services, legal, finance, accounting, human resources, sales, and marketing. The $59 million Increase over fiscal 2001 expenses was due mostly to increases in corporate employee compensation, health care pre miums, expenditures for information technology, and sales and marketing costs The company added two additional national sales representatives in early fis- cal 2005. National sales representatives call on companies that have individuals trav cling in markets served by Astor Lodge and Astor Lodge & Suites properties. Eleven national sales representatives focus on increasing guest room sales through the inclus sion of the company's hotels on approved lodging lists of corporate travel managers and travel wgencies as well as travel organizations such as the American Automo bile Association. The remaining 54 sales representatives call on local businesses 331 2003 210 257 EXHIBITS Astor Lodge Inn & Suites, Inc. Operating Statistics: Fiscal 2003-2005 (Projected) har Ended Ma 31 20052 2204 Number of Lodge and Lodge & Sales Properties Astor Lodge Properties 200 Astor Lodge & Suites Properties Total Properties so 49 250 251 Number of Lodge Rooms and Subes Rooma Uns 26,500 26.690 Suite Vales 3,500 Total Units 30,000 30,120 Occupancy Rate Astor Lodge Properties 65.0% 61.5X Astor Lodge & Suites Properties 72.5% 61.ON Total Properties 67.15 622 Average Daily Rate (ADRO Astor Lodge Properties $55.40 $55.95 Astor Lodge & Suites Properties $66.00 $50.00 Total Properties $57.52 Revenge Per Available Room (Rev PAR) Astor Lodge Properties $36.01 $34.29 Astor Lodge & Suites Properties $47.85 Total Properties 35860 Direct Cost Per Rented Room/Suite Total Properties $28.75 $38.50 27,550 3.290 30,840 58.9N 60.5% 59.0% $57.05 56100 $58.20 $33.37 $38.72 5544 $28.92 Source Com recorda gowemment agencies, universities, and other organizations that might require hotel accommodations for visitors in the markets served by the company's hotels Marketing costs rose due to added marketing research and media advertising In mid-2006, the company commissioned a large-scale study to identify the Astor Lodge & Suite guest. This study replicated a study commissioned in mid-2002 The results of these two studies are provided in Exhibit 6 on pages 332-33%. The media advertising expenditure for Astor Lodze & Suites, Inc. Increased by $1.14 million to $12.5 million in fiscal 2005. SALES AND MARKETING PLANNING AND BUDGETING Kelly Elizabeth joined Astor Lodge & Suites, Inc. in January 2003 to lead the newly formed sales and marketing department. Previously, the sales function was managed by the senior vice president of Lodging Operations. She had 17 years of sales and marketing experience in the honel hospitality Industry prior to assuming her position. As senior vice president of sales and marketing, she was responsible for sales, advertising promotions, and marketing research. Catherine Grace was hired as vice president of advertising In February 2004. She was previously media director with the advertising and public relations firm that handled the Astor Lodge & Suites, Inc. advertising account 24 nights 14.2 EXHIBIT 6 Astor Lodge & Suite Guest Profile: July-October 2004 Versus July-October 2002 (Astor Lodge and Astor Lodge & Suites, Inc. Properties Combined) July-October July-October 2004 2002 1. Average number of different occasions a guest stayed at Astor Lodge & 10.8 99 Sules during the past welve months 2. Average number of nights stayed on most recent visit 26 nights 3. Purpose of trip (percentages exceed 100% due to multiple answers) Personal 9.5% 10.05 79.8 Business 31.8 Pleasure/Vacation 13.2 Convention 3.5 20 4. Frequency of staying al models or hotels Once a week or more 39.0% 37.0% Once every few wecks 21.7 22.7 About once a month 13.1 19.0 Less often than every few months 21.2 21.3 5. Type of trip and payment on most recent visit: Business trip paid for by the company 65.7% 67.7% Business trip paid for by sell 165 16.3 Pleasure trip paid for by self 18.0 16.0 6. Rented a caren most recent trip Yes 23.196 25.554 No 75.9 7. Mode of travel on most recent trip Airline 34.0% 33.8% Car 64.8 66.2 8. Reason for choice of a particular Astor Lodge & Suite on most recent visit (percentages exceed 100h due to multiple responses Close to next day's activities 47.595 Saw hotel of sign when ready to stop 47.0% 5.7 7.0 Recommended by friend, relative, etc. 15.4 15.0 Saw or heard advertising 9.7 8.5 Specified by the company 723 Personal preference based on previous experience 6.9 48.1 19.1 Price 36.6 35.4 Stayed here before 40.9 412 Friendly and courteous staff 27.9 25.0 Other lodging accommodations full 3.1 29 9. Source of reservations Sel! Company 66.7% 6.99 11:2 12.1 Association or convention 2.7 Relative, friend, etc. 22 No reservations 5. 10. Reservation booked prior to stay 12.5 11.5 No reservation 1 to 3 days 12.5% 11.5 400 7 days 25.8 260 o 14 days 20.9 22.5 15 to 21 days 18.7 183 22 o 28 days 10.A 10.5 29 or more days 72 4.1 Travel agency July-October 2002 20.8% 5.5 2.9 4.2 69.0 July-October 11. Person(s) sharing room on most recent visit (percentages exceed 100% 2004 due to multiple responses). Spouse Children 21.6 Friends 5.2 Business associates 3.4 None, stayed alone 4.1 12. Likelihood of staying at an Astor Lodge & Suites on return visit to the area: 68.9 Extremely likely Very likely 54.25 Somewhat likely 30.3 11.9 Not very likely 2.6 Not at all likely 1.0 13. Likelihood of staying at an Astor Lodge & Suites If one were
Step by Step Solution
There are 3 Steps involved in it

Get step-by-step solutions from verified subject matter experts