

Question
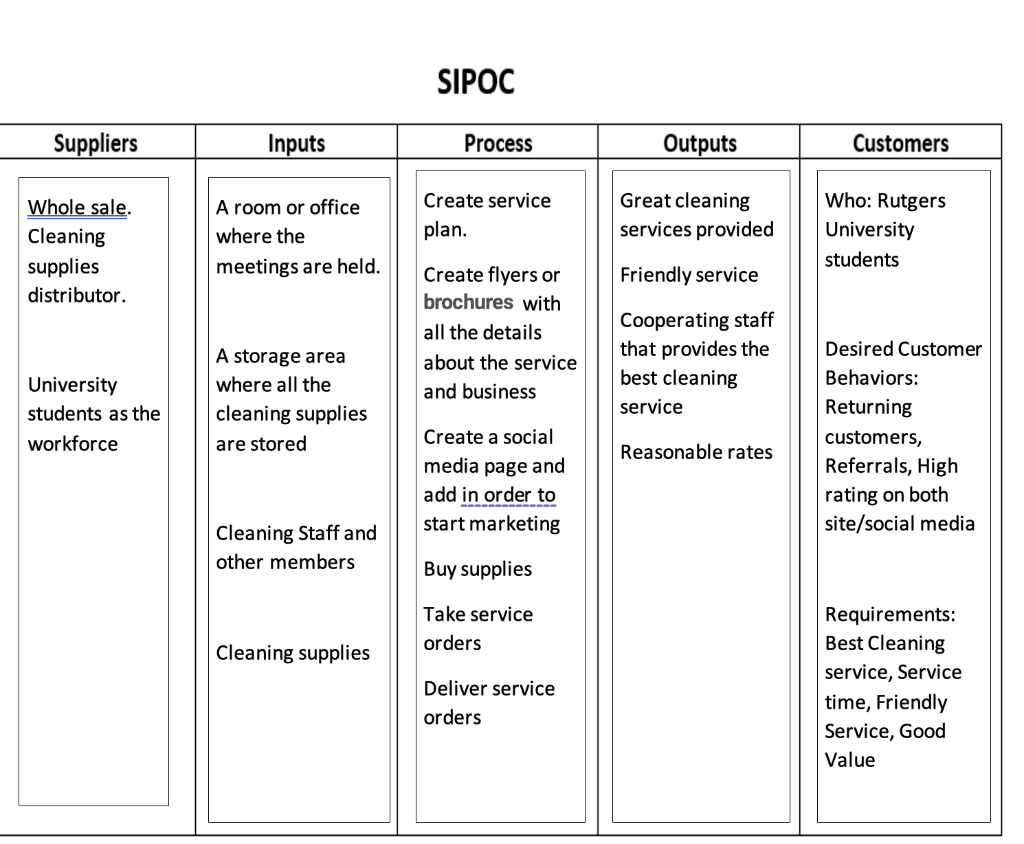
PLEASE READ THE INSTRUCTIONS CAREFULLY MY BUSINESS IS A CLEANING SERVICE FOR THE STUDENTS IN MY UNIVERSITY Now that you have mapped your process for
PLEASE READ THE INSTRUCTIONS CAREFULLY
MY BUSINESS IS A CLEANING SERVICE FOR THE STUDENTS IN MY UNIVERSITY
Now that you have mapped your process for fulfilling your customers requirements, you need to measure two things:
How effectively you are meeting those requirements
How efficiently the process operates.
Measuring the effectiveness of a process is best done from the customers perspective, i.e., from the perspective of the user of the outputs of the process. The fundamental purpose of effectiveness measurement is to understand to what extent customers are exhibiting the desired behaviors you are seeking from them (e.g., loyalty, referrals, positive feedback, etc.). Measuring those behaviors is one of the best indicators of the customers perspective of your business. If you are not getting the desired behaviors from your customers, then the outputs of your process are not fully meeting their requirements. You want to know when your process fails to meet customer requirements and that is the information that good measures of effectiveness will provide. Customer loyalty is generally one of the most important behaviors sought from customers and is a behavior that is frequently measured by businesses.
Efficiency is generally measured by evaluating the ratio of outputs to inputs. The more efficient a process is the more outputs it can create for a given set of inputs, or the less inputs required to produce a given set of outputs (in essence, the proportion of inputs required to produce more or less outputs declines). A common measure of efficiency is the cost of producing a single output (e.g., the total cost of making a single two-topping pizza). If you are becoming more efficient, over time you would expect that cost to decline without effecting the quality of the pizza you are preparing.
There are three steps to doing effective measurement:
Knowing what to measure
Knowing how to collect the right data
Knowing how to properly display the data
For this exercise, we are going to assume you have the data you need to measure effectiveness and efficiency for your business (for this second step - you can create reasonable fictional data). The exercise will focus on the first step determining what performance measures to choose, and the third step - how to properly display this data in measurement charts so the measure is a useful management tool.
The previous page described the first step what to measure. Now we will turn attention to the third step how to properly display the data.
How to properly display Performance Measurement Data
One of the most impactful ways to display performance data is to use the Well-Dressed Measure (WDM) format. This format contains the key information needed to quickly evaluate performance. A WDM:
Clearly indicates what is being measured
Has clearly labeled axes
Indicates performance compared to prior periods, key competitors, and a high-performing benchmark organization (i.e., a highly respected organization)
Clearly indicates the current goal for performance
Clearly states the performance status (exceeding goal, meeting goal, not meeting goal)
Explains the reason for that status
Indicates when the measure was most recently updated
Indicates who is responsible for this measure (specific person or department/team)
Indicates if any improvement initiatives are underway to impact the performance and identifies the objectives of those initiatives
When a measurement chart conforms with WDM standards, it is easy for management to quickly understand the performance status displayed by the measurement chart and they can then determine if additional action is warranted to address any performance gaps or to assure continued good performance.
On the next page is an example of a WDM measurement chart that is measuring effectiveness for a pizza business.
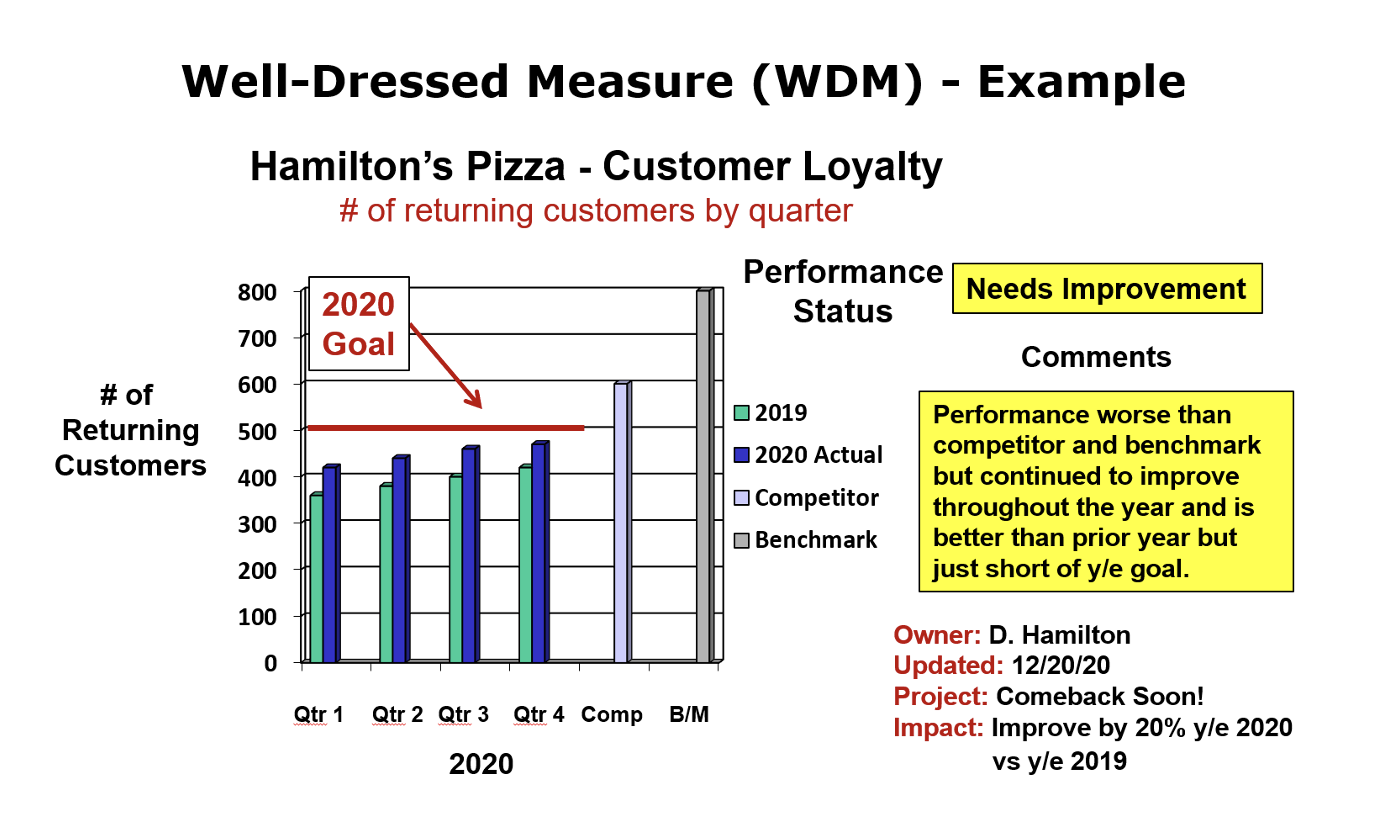
This type of measurement chart can be created in PowerPoint using data from an Excel worksheet. This chart was created on a PowerPoint slide and then was captured with a Snipping tool and pasted here.
Becoming familiar with how to use Microsoft Office products is beneficial as most businesses regularly use these tools. If you are not sure how to do this, search online for instructions on how to create a chart in PowerPoint. Additional text you see on the chart was included using the Insert Text Box feature in PowerPoint.
Individual Activity for Exercise 10B
For this exercise you are to prepare two WDM formatted measurement charts for your teams business.
First, prepare a measurement chart in WDM format to measure effectiveness of the process you described in Exercise 10 A.
SIPOC Hamilton's Pizza - Customer Loyalty # of returning customers by quarter SIPOC Hamilton's Pizza - Customer Loyalty # of returning customers by quarterStep by Step Solution
There are 3 Steps involved in it
Step: 1

Get Instant Access to Expert-Tailored Solutions
See step-by-step solutions with expert insights and AI powered tools for academic success
Step: 2

Step: 3
Ace Your Homework with AI
Get the answers you need in no time with our AI-driven, step-by-step assistance
Get Started
Financial Accounting For Management
Authors: N Ramachandran
3rd Edition
1259004694, 978-1259004698