

Answered step by step
Verified Expert Solution
Question
1 Approved Answer
Please read the question first 3. Consider the following Aggregate supply: yt=yn+[ptwt],>0 where yn is a natural level of output, and w is nominal wage
 Please read the question first
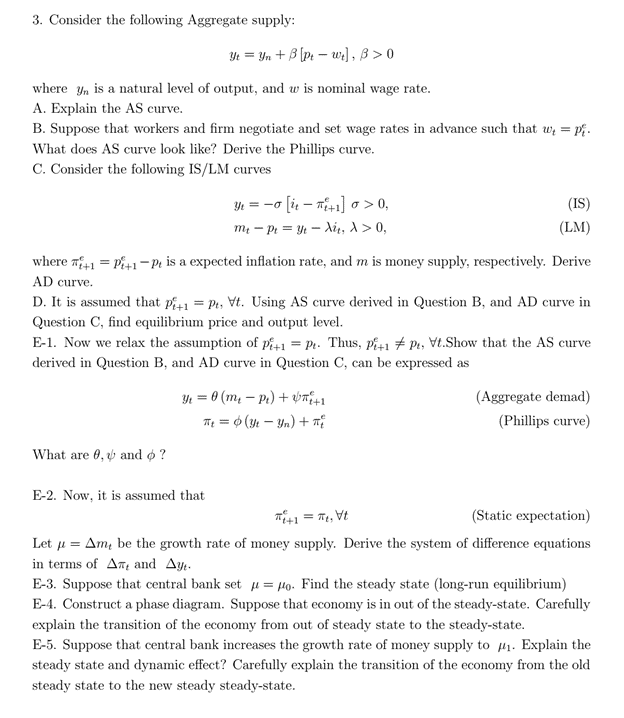
3. Consider the following Aggregate supply: yt=yn+[ptwt],>0 where yn is a natural level of output, and w is nominal wage rate. A. Explain the AS curve. B. Suppose that workers and firm negotiate and set wage rates in advance such that wt=pte. What does AS curve look like? Derive the Phillips curve. C. Consider the following IS/LM curves yt=[itt+1e]>0,mtpt=ytit,>0, where t+1t=pt+1ept is a expected inflation rate, and m is money supply, respectively. Derive AD curve. D. It is assumed that pt+1e=pt,t. Using AS curve derived in Question B, and AD curve in Question C, find equilibrium price and output level. E-1. Now we relax the assumption of pt+1e=pt. Thus, pt+1e=pt,t.Show that the AS curve derived in Question B, and AD curve in Question C, can be expressed as yt=(mtpt)+t+1et=(ytyn)+te (Aggregate demad) (Phillips curve) What are , and ? E-2. Now, it is assumed that t+1e=t,t (Static expectation) Let =mt be the growth rate of money supply. Derive the system of difference equations in terms of t and yt. E-3. Suppose that central bank set =0. Find the steady state (long-run equilibrium) E-4. Construct a phase diagram. Suppose that economy is in out of the steady-state. Carefully explain the transition of the economy from out of steady state to the steady-state. E-5. Suppose that central bank increases the growth rate of money supply to 1. Explain the steady state and dynamic effect? Carefully explain the transition of the economy from the old steady state to the new steady steady-state. 3. Consider the following Aggregate supply: yt=yn+[ptwt],>0 where yn is a natural level of output, and w is nominal wage rate. A. Explain the AS curve. B. Suppose that workers and firm negotiate and set wage rates in advance such that wt=pte. What does AS curve look like? Derive the Phillips curve. C. Consider the following IS/LM curves yt=[itt+1e]>0,mtpt=ytit,>0, where t+1t=pt+1ept is a expected inflation rate, and m is money supply, respectively. Derive AD curve. D. It is assumed that pt+1e=pt,t. Using AS curve derived in Question B, and AD curve in Question C, find equilibrium price and output level. E-1. Now we relax the assumption of pt+1e=pt. Thus, pt+1e=pt,t.Show that the AS curve derived in Question B, and AD curve in Question C, can be expressed as yt=(mtpt)+t+1et=(ytyn)+te (Aggregate demad) (Phillips curve) What are , and ? E-2. Now, it is assumed that t+1e=t,t (Static expectation) Let =mt be the growth rate of money supply. Derive the system of difference equations in terms of t and yt. E-3. Suppose that central bank set =0. Find the steady state (long-run equilibrium) E-4. Construct a phase diagram. Suppose that economy is in out of the steady-state. Carefully explain the transition of the economy from out of steady state to the steady-state. E-5. Suppose that central bank increases the growth rate of money supply to 1. Explain the steady state and dynamic effect? Carefully explain the transition of the economy from the old steady state to the new steady steady-state
Step by Step Solution
There are 3 Steps involved in it
Step: 1

Get Instant Access to Expert-Tailored Solutions
See step-by-step solutions with expert insights and AI powered tools for academic success
Step: 2

Step: 3
Ace Your Homework with AI
Get the answers you need in no time with our AI-driven, step-by-step assistance
Get Started
Audit Quality And Financial Statements Fraud Detection
Authors: Asma Al-znaimat, Mohammad Al- Dahiyat
1st Edition
3659537888, 978-3659537882