Answered step by step
Verified Expert Solution
Link Copied!

Question

1 Approved Answer

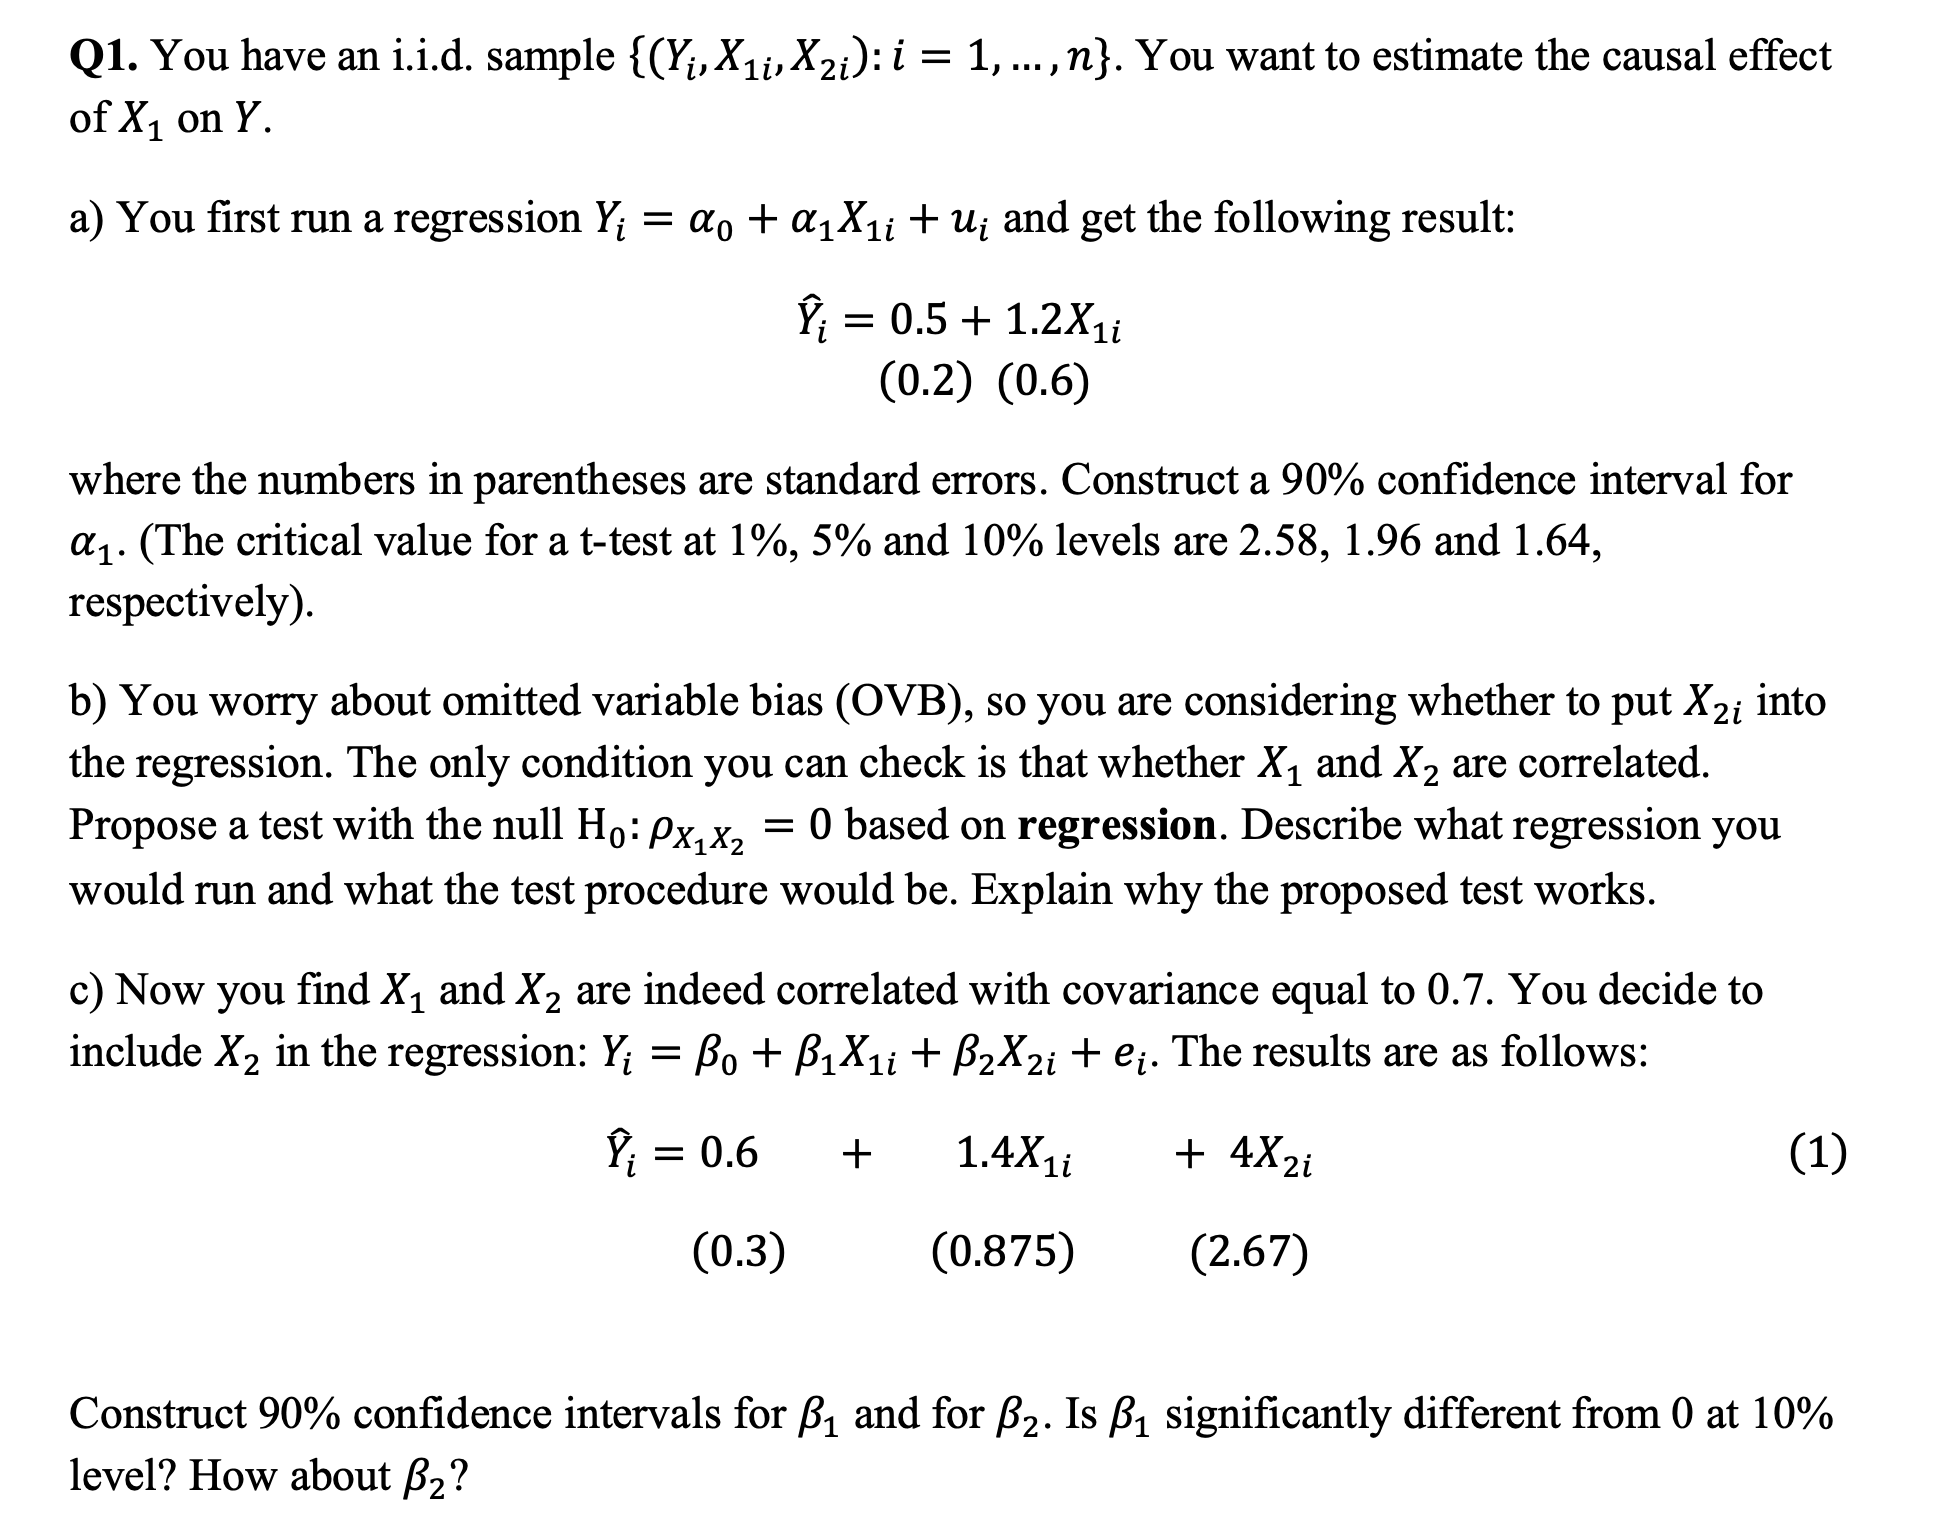
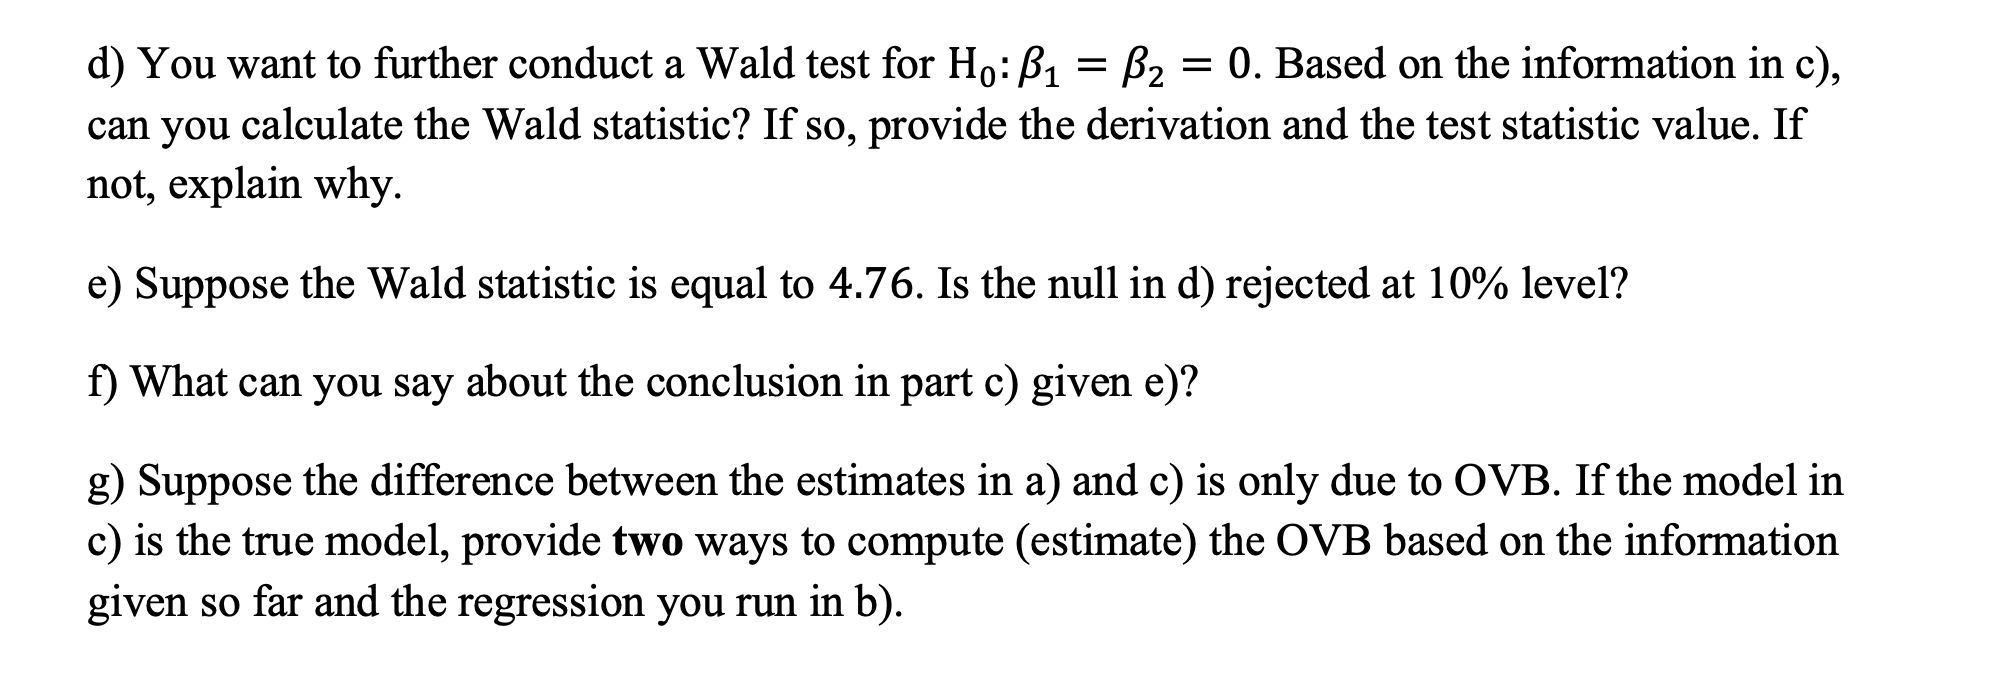
Please refer to the attached picture Q1. You have an i.i.d. sample {(Yi, X if, X 2i): i = 1, , n}. You want to

Please refer to the attached picture

image text in transcribedimage text in transcribed
Q1. You have an i.i.d. sample {(Yi, X if, X 2i): i = 1, , n}. You want to estimate the causal effect of X1 on Y. a) You rst run a regression Yi = a0 + alei + ui and get the following result: Y. = 0.5 + 1.2x\"- (0.2) (0.6) where the numbers in parentheses are standard errors. Construct a 90% confidence interval for al. (The critical value for a t-test at 1%, 5% and 10% levels are 2.58, 1.96 and 1.64, respectively). b) You worry about omitted variable bias (OVB), so you are considering whether to put X 21- into the regression. The only condition you can check is that whether X1 and X 2 are correlated. Propose a test with the null Ho: pX1X2 = 0 based on regression. Describe what regression you would run and what the test procedure would be. Explain why the proposed test works. c) Now you nd X1 and X 2 are indeed correlated with covariance equal to 0.7. You decide to include X2 in the regression: Yi = )60 + lei + ,BzXzi + ei. The results are as follows: 17i=0.6 + 1.4-X1i + 4X2i (1) (0.3) (0.875) (2.67) Construct 90% condence intervals for 51 and for 32. Is 51 signicantly different from 0 at 10% level? How about [32? d) You want to further conduct a Wald test for H0: ,81 = B2 = 0. Based on the information in c), can you calculate the Wald statistic? If so, provide the derivation and the test statistic value. If not, explain why. e) Suppose the Wald statistic is equal to 4.76. Is the null in d) rejected at 10% level? f) What can you say about the conclusion in part c) given e)? g) Suppose the difference between the estimates in a) and c) is only due to OVB. If the model in c) is the true model, provide two ways to compute (estimate) the OVB based on the information given so far and the regression you run in b)

Step by Step Solution

There are 3 Steps involved in it

Step: 1

blur-text-image

Get Instant Access to Expert-Tailored Solutions

See step-by-step solutions with expert insights and AI powered tools for academic success

Step: 2

blur-text-image

Step: 3

blur-text-image

Ace Your Homework with AI

Get the answers you need in no time with our AI-driven, step-by-step assistance

Get Started

Recommended Textbook for

Business Analytics Data Analysis and Decision Making

Authors: S. Christian Albright, Wayne L. Winston

5th edition

1133629601, 9781285965529 , 978-1133629603

More Books

Students also viewed these Mathematics questions