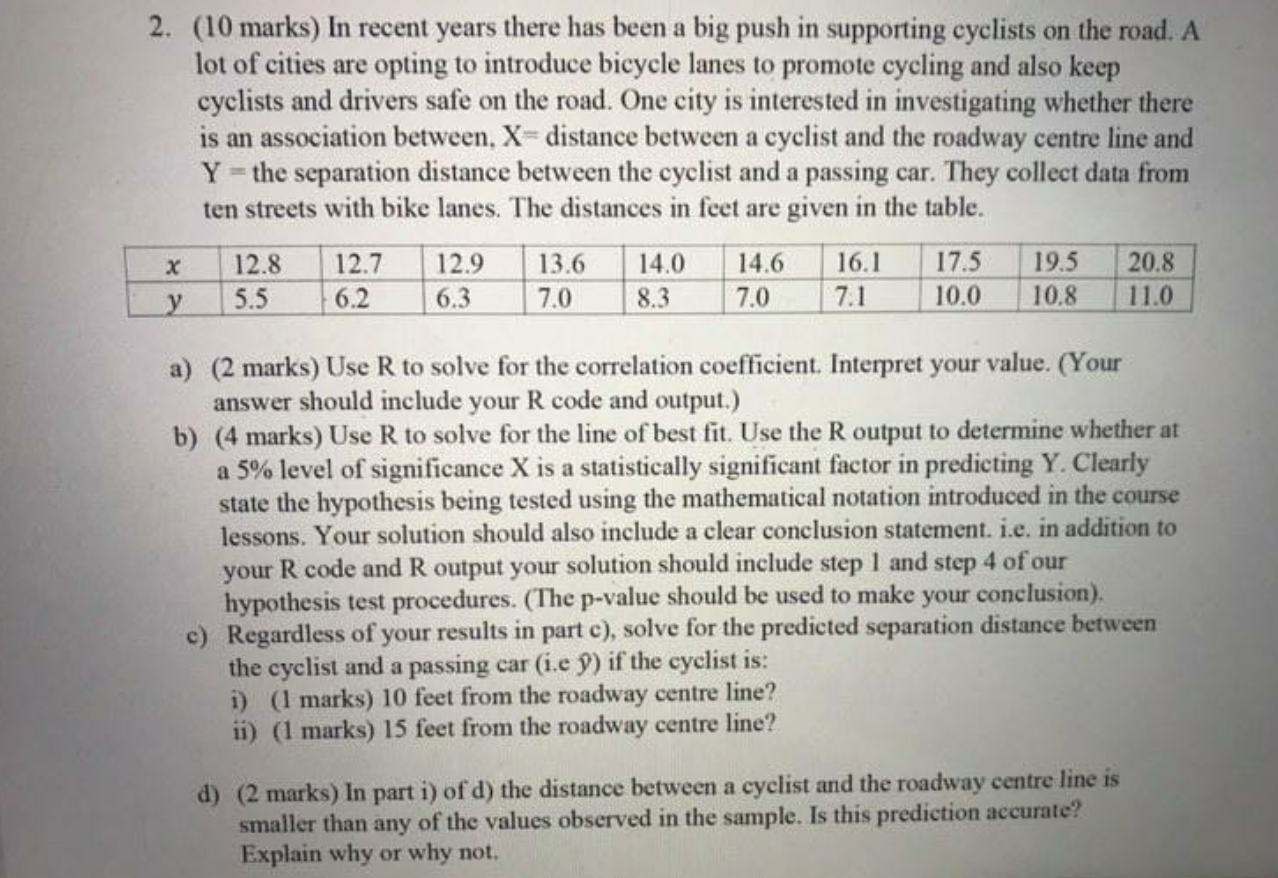
Please refer to the following image
2. (10 marks) In recent years there has been a big push in supporting cyclists on the road. A lot of cities are opting to introduce bicycle lanes to promote cycling and also keep cyclists and drivers safe on the road. One city is interested in investigating whether there is an association between, X- distance between a cyclist and the roadway centre line and Y - the separation distance between the cyclist and a passing car. They collect data from ten streets with bike lanes. The distances in feet are given in the table. x 12.8 12.7 12.9 13.6 14.0 14.6 16.1 17.5 19.5 20.8 y 5.5 6.2 6.3 7.0 8.3 7.0 7.1 10.0 10.8 11.0 a) (2 marks) Use R to solve for the correlation coefficient. Interpret your value. (Your answer should include your R code and output.) b) (4 marks) Use R to solve for the line of best fit. Use the R output to determine whether at a 5% level of significance X is a statistically significant factor in predicting Y. Clearly state the hypothesis being tested using the mathematical notation introduced in the course lessons. Your solution should also include a clear conclusion statement. i.e. in addition to your R code and R output your solution should include step 1 and step 4 of our hypothesis test procedures. (The p-value should be used to make your conclusion). c) Regardless of your results in part c), solve for the predicted separation distance between the cyclist and a passing car (i.e y) if the cyclist is: i) (1 marks) 10 feet from the roadway centre line? ii) (1 marks) 15 feet from the roadway centre line? d) (2 marks) In part i) of d) the distance between a cyclist and the roadway centre line is smaller than any of the values observed in the sample. Is this prediction accurate? Explain why or why not