Answered step by step
Verified Expert Solution
Question
1 Approved Answer
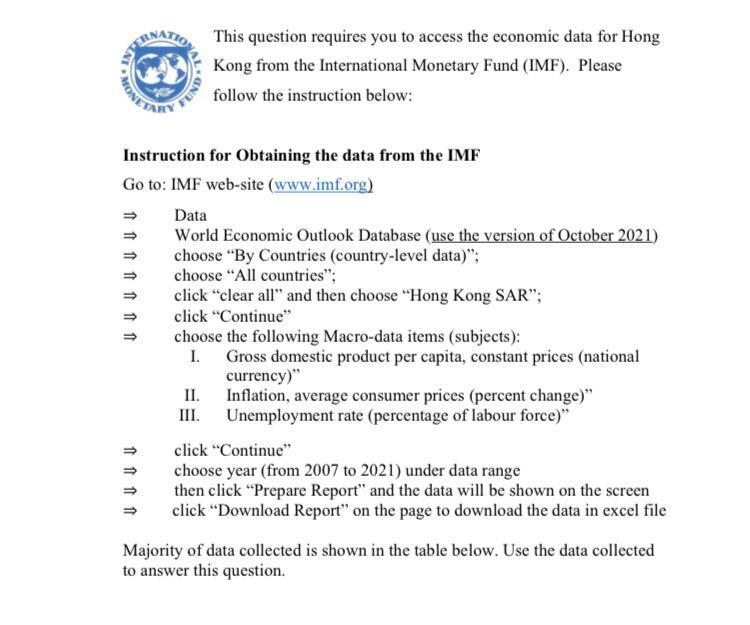
please require an update if you need any INTE LUN This question requires you to access the economic data for Hong Kong from the International


please require an update if you need any
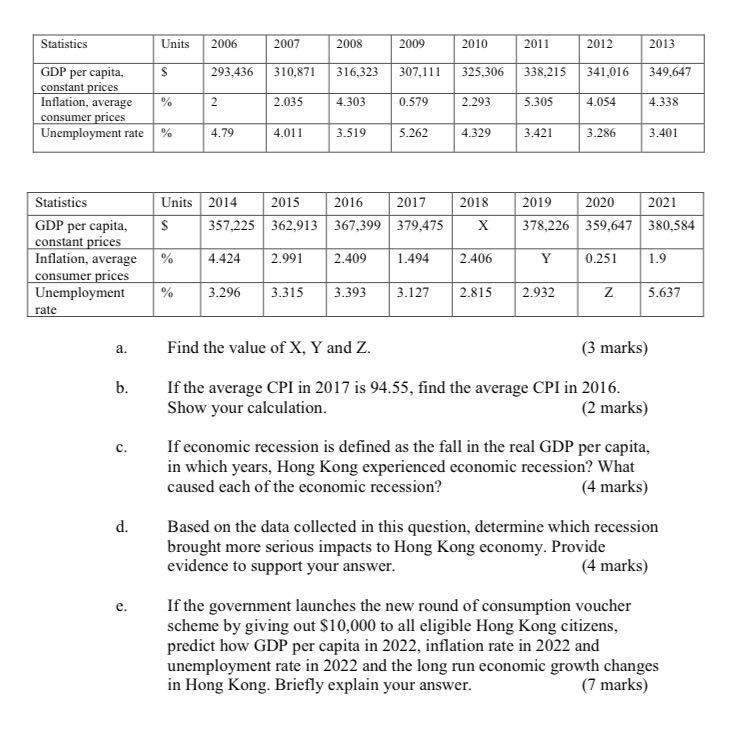
INTE LUN This question requires you to access the economic data for Hong Kong from the International Monetary Fund (IMF). Please follow the instruction below: *REONE 1 1 1 1 1 1 1 Instruction for Obtaining the data from the IMF Go to: IMF web-site (www.imf.org) Data World Economic Outlook Database (use the version of October 2021) choose "By Countries (country-level data)"; choose "All countries": click"clear all" and then choose "Hong Kong SAR"; click "Continue" choose the following Macro-data items (subjects): I. Gross domestic product per capita, constant prices (national currency)" II. Inflation, average consumer prices (percent change)" III. Unemployment rate (percentage of labour force)" click "Continue" choose year (from 2007 to 2021) under data range then click Prepare Report" and the data will be shown on the screen click Download Report on the page to download the data in excel file Majority of data collected is shown in the table below. Use the data collected to answer this question. 1 1 1 1 2006 2007 2009 2008 316,323 2010 2011 2012 2013 325,306 338,215 341,016 349,647 293,436 310,871 307,111 Statistics Units GDP per capita $ constant prices Inflation, average % consumer prices Unemployment rate % 2 2.035 4.303 0.579 2.293 5.305 4.054 4.338 4.79 4.011 3.519 5.262 4.329 3.421 3.286 3.401 2018 Units 2014 2015 2016 2017 $ 357,225 362,913 367,399 379,475 2019 2020 2021 378,226 359,647 380,584 X Statistics GDP per capita, constant prices Inflation, average consumer prices Unemployment rate % 4.424 2.991 2.409 1.494 2.406 Y 0.251 1.9 % 3.296 3.315 3.393 3.127 2.815 2.932 z 5.637 a. Find the value of X, Y and Z. (3 marks) b. If the average CPI in 2017 is 94.55, find the average CPI in 2016. Show your calculation (2 marks) If economic recession is defined as the fall in the real GDP per capita, in which years, Hong Kong experienced economic recession? What caused each of the economic recession? (4 marks) c. d. e. e. Based on the data collected in this question, determine which recession brought more serious impacts to Hong Kong economy. Provide evidence to support your answer. (4 marks) If the government launches the new round of consumption voucher scheme by giving out $10,000 to all eligible Hong Kong citizens, predict how GDP per capita in 2022, inflation rate in 2022 and unemployment rate in 2022 and the long run economic growth changes in Hong Kong. Briefly explain your answer. (7 marks) A B D F G H I K L M N 0 Scale Units 1 Country 2 Hong Kong SAR 3 Hong Kong SAR 4 Hong Kong SAR 5 6 Subject Descriptor Gross domestic product per capita, constant prices Inflation, average consumer prices Unemployment rate Units National currency Percent change Percent of total labor force 2007 310,870.66 2.035 4.011 2008 2009 2010 316,323.18 307,111.09 325,305.51 4.303 0.579 2.293 3.519 5.262 4.329 2011 338,215.06 5.305 3.421 2012 341,015.90 4.054 3.286 2013 349,647.20 4.338 3.401 2014 357,225.11 4.424 3.296 2015 362,912.84 2.991 3.315 7 Units Gross domestic product per capita, constant prices Inflation, average consumer prices Unemployment rate 2016 367,398.57 2.409 3.393 National currency Percent change Percent of total labor force 2017 2018 2019 379,474.85 386,455.17 378.225.72 1.494 2.406 2.883 3.127 2.815 2.932 2020 359,647.43 0.251 5.828 8 9 9 2021 Estimates Start After 380,583.68 2020 1.9 2020 5.637 2020 10 11 12 13 14 15 16 17 18 19 20 Intemational Monetary Fund, World Economic Outlook Database, October 2021 21 22 INTE LUN This question requires you to access the economic data for Hong Kong from the International Monetary Fund (IMF). Please follow the instruction below: *REONE 1 1 1 1 1 1 1 Instruction for Obtaining the data from the IMF Go to: IMF web-site (www.imf.org) Data World Economic Outlook Database (use the version of October 2021) choose "By Countries (country-level data)"; choose "All countries": click"clear all" and then choose "Hong Kong SAR"; click "Continue" choose the following Macro-data items (subjects): I. Gross domestic product per capita, constant prices (national currency)" II. Inflation, average consumer prices (percent change)" III. Unemployment rate (percentage of labour force)" click "Continue" choose year (from 2007 to 2021) under data range then click Prepare Report" and the data will be shown on the screen click Download Report on the page to download the data in excel file Majority of data collected is shown in the table below. Use the data collected to answer this question. 1 1 1 1 2006 2007 2009 2008 316,323 2010 2011 2012 2013 325,306 338,215 341,016 349,647 293,436 310,871 307,111 Statistics Units GDP per capita $ constant prices Inflation, average % consumer prices Unemployment rate % 2 2.035 4.303 0.579 2.293 5.305 4.054 4.338 4.79 4.011 3.519 5.262 4.329 3.421 3.286 3.401 2018 Units 2014 2015 2016 2017 $ 357,225 362,913 367,399 379,475 2019 2020 2021 378,226 359,647 380,584 X Statistics GDP per capita, constant prices Inflation, average consumer prices Unemployment rate % 4.424 2.991 2.409 1.494 2.406 Y 0.251 1.9 % 3.296 3.315 3.393 3.127 2.815 2.932 z 5.637 a. Find the value of X, Y and Z. (3 marks) b. If the average CPI in 2017 is 94.55, find the average CPI in 2016. Show your calculation (2 marks) If economic recession is defined as the fall in the real GDP per capita, in which years, Hong Kong experienced economic recession? What caused each of the economic recession? (4 marks) c. d. e. e. Based on the data collected in this question, determine which recession brought more serious impacts to Hong Kong economy. Provide evidence to support your answer. (4 marks) If the government launches the new round of consumption voucher scheme by giving out $10,000 to all eligible Hong Kong citizens, predict how GDP per capita in 2022, inflation rate in 2022 and unemployment rate in 2022 and the long run economic growth changes in Hong Kong. Briefly explain your answer. (7 marks) A B D F G H I K L M N 0 Scale Units 1 Country 2 Hong Kong SAR 3 Hong Kong SAR 4 Hong Kong SAR 5 6 Subject Descriptor Gross domestic product per capita, constant prices Inflation, average consumer prices Unemployment rate Units National currency Percent change Percent of total labor force 2007 310,870.66 2.035 4.011 2008 2009 2010 316,323.18 307,111.09 325,305.51 4.303 0.579 2.293 3.519 5.262 4.329 2011 338,215.06 5.305 3.421 2012 341,015.90 4.054 3.286 2013 349,647.20 4.338 3.401 2014 357,225.11 4.424 3.296 2015 362,912.84 2.991 3.315 7 Units Gross domestic product per capita, constant prices Inflation, average consumer prices Unemployment rate 2016 367,398.57 2.409 3.393 National currency Percent change Percent of total labor force 2017 2018 2019 379,474.85 386,455.17 378.225.72 1.494 2.406 2.883 3.127 2.815 2.932 2020 359,647.43 0.251 5.828 8 9 9 2021 Estimates Start After 380,583.68 2020 1.9 2020 5.637 2020 10 11 12 13 14 15 16 17 18 19 20 Intemational Monetary Fund, World Economic Outlook Database, October 2021 21 22Step by Step Solution
There are 3 Steps involved in it
Step: 1

Get Instant Access to Expert-Tailored Solutions
See step-by-step solutions with expert insights and AI powered tools for academic success
Step: 2

Step: 3

Ace Your Homework with AI
Get the answers you need in no time with our AI-driven, step-by-step assistance
Get Started


