Answered step by step
Verified Expert Solution
Question
1 Approved Answer
please respond to e, f, & g. thanks! Suppose now that two months has passed, and the following table summarizes the actual dynamics of grain
please respond to e, f, & g. thanks! 

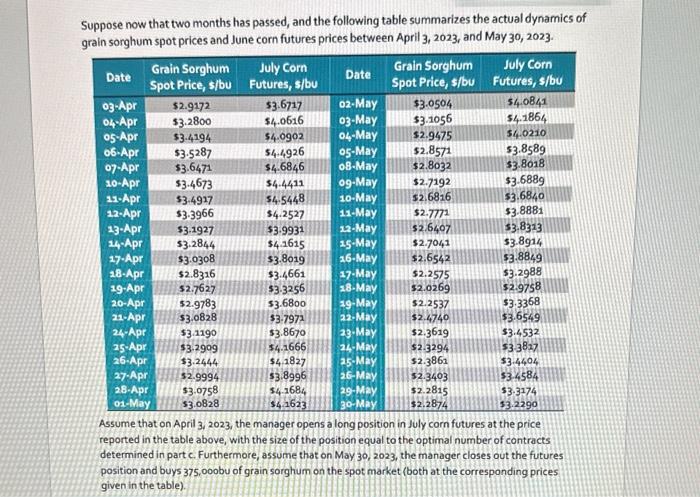
Suppose now that two months has passed, and the following table summarizes the actual dynamics of grain sorahum spot prices and June corn futures prices between April 3, 2023, and May 30, 2023. Assume that on Apri1 3, 2023, the manager opens a Iong position in July corn futures at the price: reported in the table above, with the size of the position equal to the optimal number of contracts determined in part c. Furthermore, assume that on May 30, 2023, the manager closes out the futures position and buys 375,000 bu of grain sorghum on the spot market (both at the corresponding prices given in the table). e. Construct a series of effective net prices between April 3, 2023, and May 30, 2023. To do so, calculate the ENP for each day "as if" the company liquidated the hedge and bought grain sorghum on the spot market on that day. Plot the spot prices and constructed ENP series on the same graph. f. Calculate the sample standard deviations of grain sorghum spot prices and effective net prices between April 3, 2023, and May 30, 2023 (use provided data for spot prices and the ENP series constructed in parte.). 9. Comment on the effectiveness of the hedging strategy. Suppose now that two months has passed, and the following table summarizes the actual dynamics of grain sorahum spot prices and June corn futures prices between April 3, 2023, and May 30, 2023. Assume that on Apri1 3, 2023, the manager opens a Iong position in July corn futures at the price: reported in the table above, with the size of the position equal to the optimal number of contracts determined in part c. Furthermore, assume that on May 30, 2023, the manager closes out the futures position and buys 375,000 bu of grain sorghum on the spot market (both at the corresponding prices given in the table). e. Construct a series of effective net prices between April 3, 2023, and May 30, 2023. To do so, calculate the ENP for each day "as if" the company liquidated the hedge and bought grain sorghum on the spot market on that day. Plot the spot prices and constructed ENP series on the same graph. f. Calculate the sample standard deviations of grain sorghum spot prices and effective net prices between April 3, 2023, and May 30, 2023 (use provided data for spot prices and the ENP series constructed in parte.). 9. Comment on the effectiveness of the hedging strategy 

Step by Step Solution
There are 3 Steps involved in it
Step: 1

Get Instant Access to Expert-Tailored Solutions
See step-by-step solutions with expert insights and AI powered tools for academic success
Step: 2

Step: 3

Ace Your Homework with AI
Get the answers you need in no time with our AI-driven, step-by-step assistance
Get Started


