Question: Please review and use the materials provided in the Harvard Case Study Readings for The Quest for Sustainable Public Transit Funding: SEPTAs 2013 Capital Budget
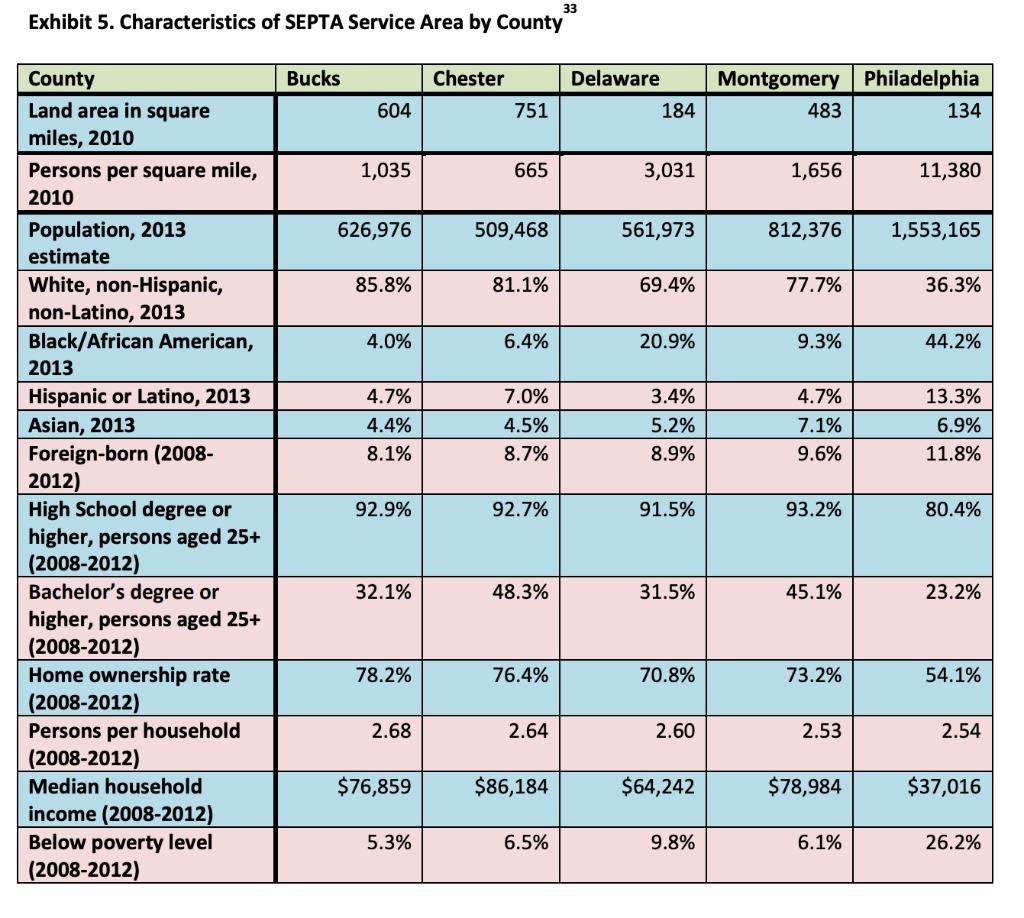
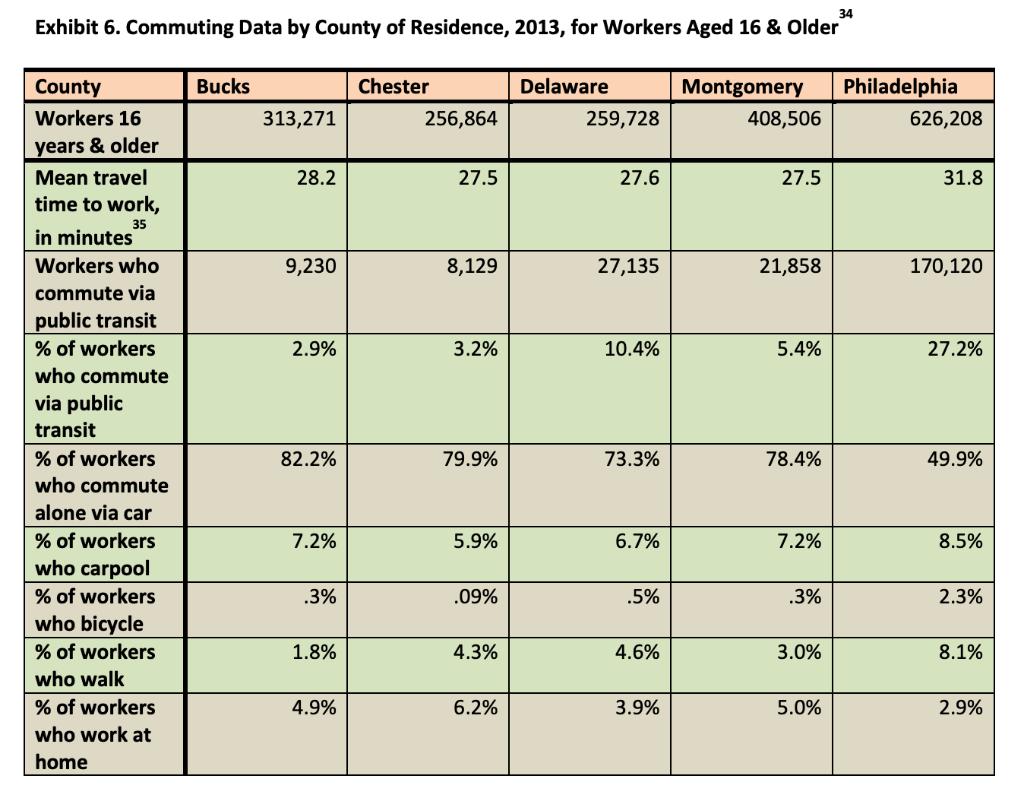
Please review and use the materials provided in the Harvard Case Study Readings for “The Quest for Sustainable Public Transit Funding: SEPTA’s 2013 Capital Budget Crisis”. This paper provides sufficient data in Exhibits 8 and 9 to answer the Total Revenue, Subsidy and Elasticity Questions. Exhibits 5 and 6 offer insight into the demographic information. This is an analytic question that uses math for a decision making process.
Also, the elasticity equation you will need to use is:
Price Elasticity of Demand = (P/Q)times(Change in Q/Change in P)
You are provided different elasticity scenarios offered (based on price increases of between 5% and 20%)
- When reviewing Exhibits 5 and 6, what data stands out as the population that is more likely to use Public Transportation?
- Would Total Revenue increase or decrease if the per ride fares were increased by 5% or 20% and How much will they go up (this requires a numeric answer and you must show your work)?
- According to this analysis, can fare increases eliminate the State’s Operating Subsidy and why?
- What are the implications on fairness that these increases create?


Exhibit 5. Characteristics of SEPTA Service Area by County County Land area in square miles, 2010 Persons per square mile, 2010 Population, 2013 estimate White, non-Hispanic, non-Latino, 2013 Black/African American, 2013 Hispanic or Latino, 2013 Asian, 2013 Foreign-born (2008- 2012) High School degree or higher, persons aged 25+ (2008-2012) Bachelor's degree or higher, persons aged 25+ (2008-2012) Home ownership rate (2008-2012) Persons per household (2008-2012) Median household income (2008-2012) Below poverty level (2008-2012) Bucks 604 1,035 626,976 85.8% 4.0% 4.7% 4.4% 8.1% 92.9% 32.1% 78.2% 2.68 $76,859 5.3% Chester 751 665 509,468 81.1% 6.4% 7.0% 4.5% 8.7% 92.7% 48.3% 76.4% 2.64 $86,184 6.5% 33 Delaware Montgomery Philadelphia 184 3,031 561,973 69.4% 20.9% 3.4% 5.2% 8.9% 91.5% 31.5% 70.8% 2.60 $64,242 9.8% 483 1,656 812,376 77.7% 9.3% 4.7% 7.1% 9.6% 93.2% 45.1% 73.2% 2.53 $78,984 6.1% 134 11,380 1,553,165 36.3% 44.2% 13.3% 6.9% 11.8% 80.4% 23.2% 54.1% 2.54 $37,016 26.2%
Step by Step Solution
3.36 Rating (162 Votes )
There are 3 Steps involved in it
ANSWER 1 In this data collection those who use public transit more frequently are highlighted Accord... View full answer

Get step-by-step solutions from verified subject matter experts


