Question
Please review if I answered the 4th question in write up section correctly and let me know if I need to change something. I also
Please review if I answered the 4th question in write up section correctly and let me know if I need to change something. I also need help answering the fifth question. Also, If you find any other mistakes, I will aprreciate the help. God bless!!
II DEPENDENT t-Test
Research question: "is there statistically significant weight loss (pre vs. post) for people who exercised in a hot environment?"
Assumptions Testing
- Data level of measurement-what was the level of measurement for the data used in this case study?
The level of measurement for the variables hot was nominal, and for the variable pre/post workout, it was interval.
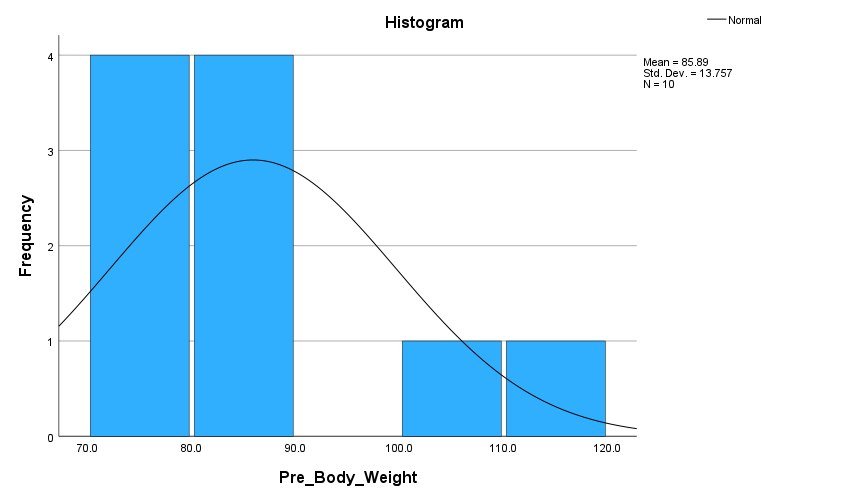
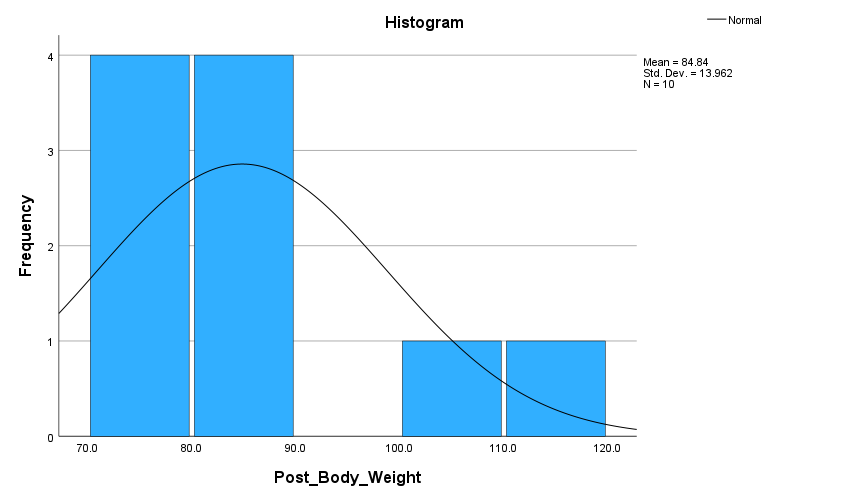
2. Would the amount of skewness and kurtosis in these variables affect the analysis? How do you know? Give numerical values to support your conclusion.
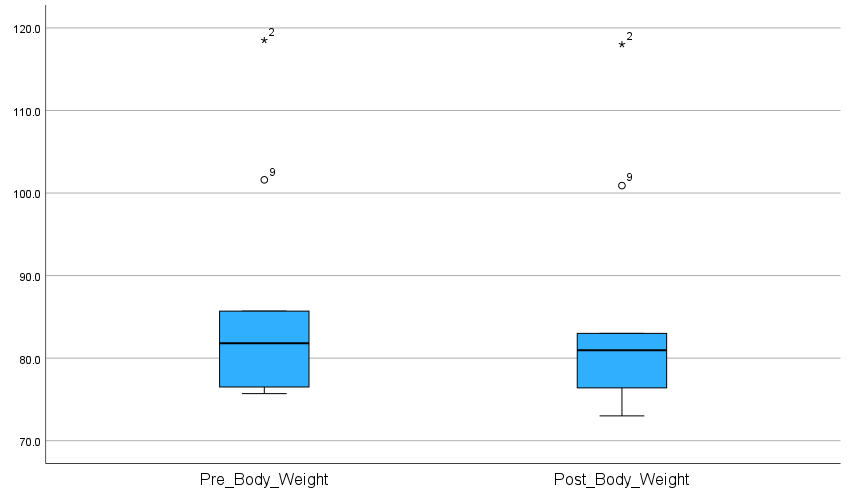
The skewness and kurtosis in these variables did not affect the analysis because the skewness for pre-workout was calculated as 1.870/. 687=2.721, and the kurtosis was calculated as 3.122/1.334=2.340; for post-workout, skewness was calculated as 1.885/. 687=2.743, and the kurtosis was calculated as 3.195/1.334=2.395. They did not fall between -.1.96 and 1.96 intervals.
Table 1. PASTE TABLE with skewness and kurtosis BELOW
Descriptives | |||
Statistic | Std. Error | ||
Pre_Body_Weight | Mean | 85.890 | 4.3502 |
95% Confidence Interval for Mean | Lower Bound | 76.049 | |
Upper Bound | 95.731 | ||
5% Trimmed Mean | 84.644 | ||
Median | 81.800 | ||
Variance | 189.245 | ||
Std. Deviation | 13.7567 | ||
Minimum | 75.7 | ||
Maximum | 118.5 | ||
Range | 42.8 | ||
Interquartile Range | 13.3 | ||
Skewness | 1.870 | .687 | |
Kurtosis | 3.122 | 1.334 | |
Post_Body_Weight | Mean | 84.840 | 4.4152 |
95% Confidence Interval for Mean | Lower Bound | 74.852 | |
Upper Bound | 94.828 | ||
5% Trimmed Mean | 83.656 | ||
Median | 80.950 | ||
Variance | 194.943 | ||
Std. Deviation | 13.9622 | ||
Minimum | 73.0 | ||
Maximum | 118.0 | ||
Range | 45.0 | ||
Interquartile Range | 11.3 | ||
Skewness | 1.885 | .687 | |
Kurtosis | 3.195 | 1.334 |
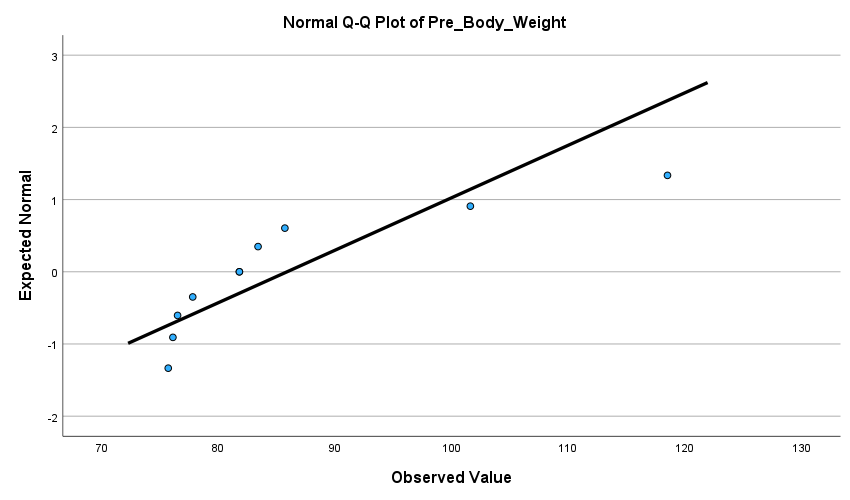
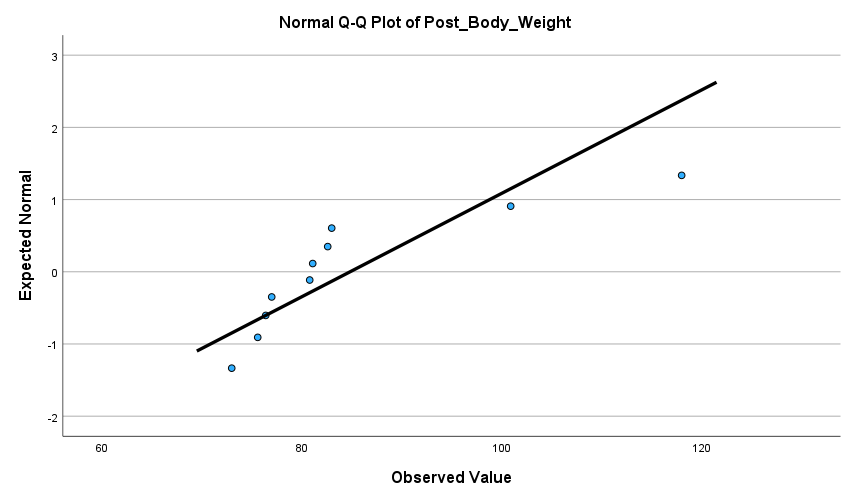
3. Was the assumption of normality met and how do you know?
The assumption of normality was not met because the p-value for Pre/Post Body Weight = .003, which is less than the alpha value of .05.
Table 2. PASTE Tests of NORMALITY table BELOW
Tests of Normality | ||||||
Kolmogorov-Smirnova | Shapiro-Wilk | |||||
Statistic | df | Sig. | Statistic | df | Sig. | |
Pre_Body_Weight | .306 | 10 | .009 | .744 | 10 | .003 |
Post_Body_Weight | .352 | 10 | <.001> | .749 | 10 | .003 |
a. Lilliefors Significance Correction |
Figure 1. PASTE Histogram with normal curve for each variable BELOW

Step by Step Solution
There are 3 Steps involved in it
Step: 1

Get Instant Access to Expert-Tailored Solutions
See step-by-step solutions with expert insights and AI powered tools for academic success
Step: 2

Step: 3

Ace Your Homework with AI
Get the answers you need in no time with our AI-driven, step-by-step assistance
Get Started


