Please see attached.
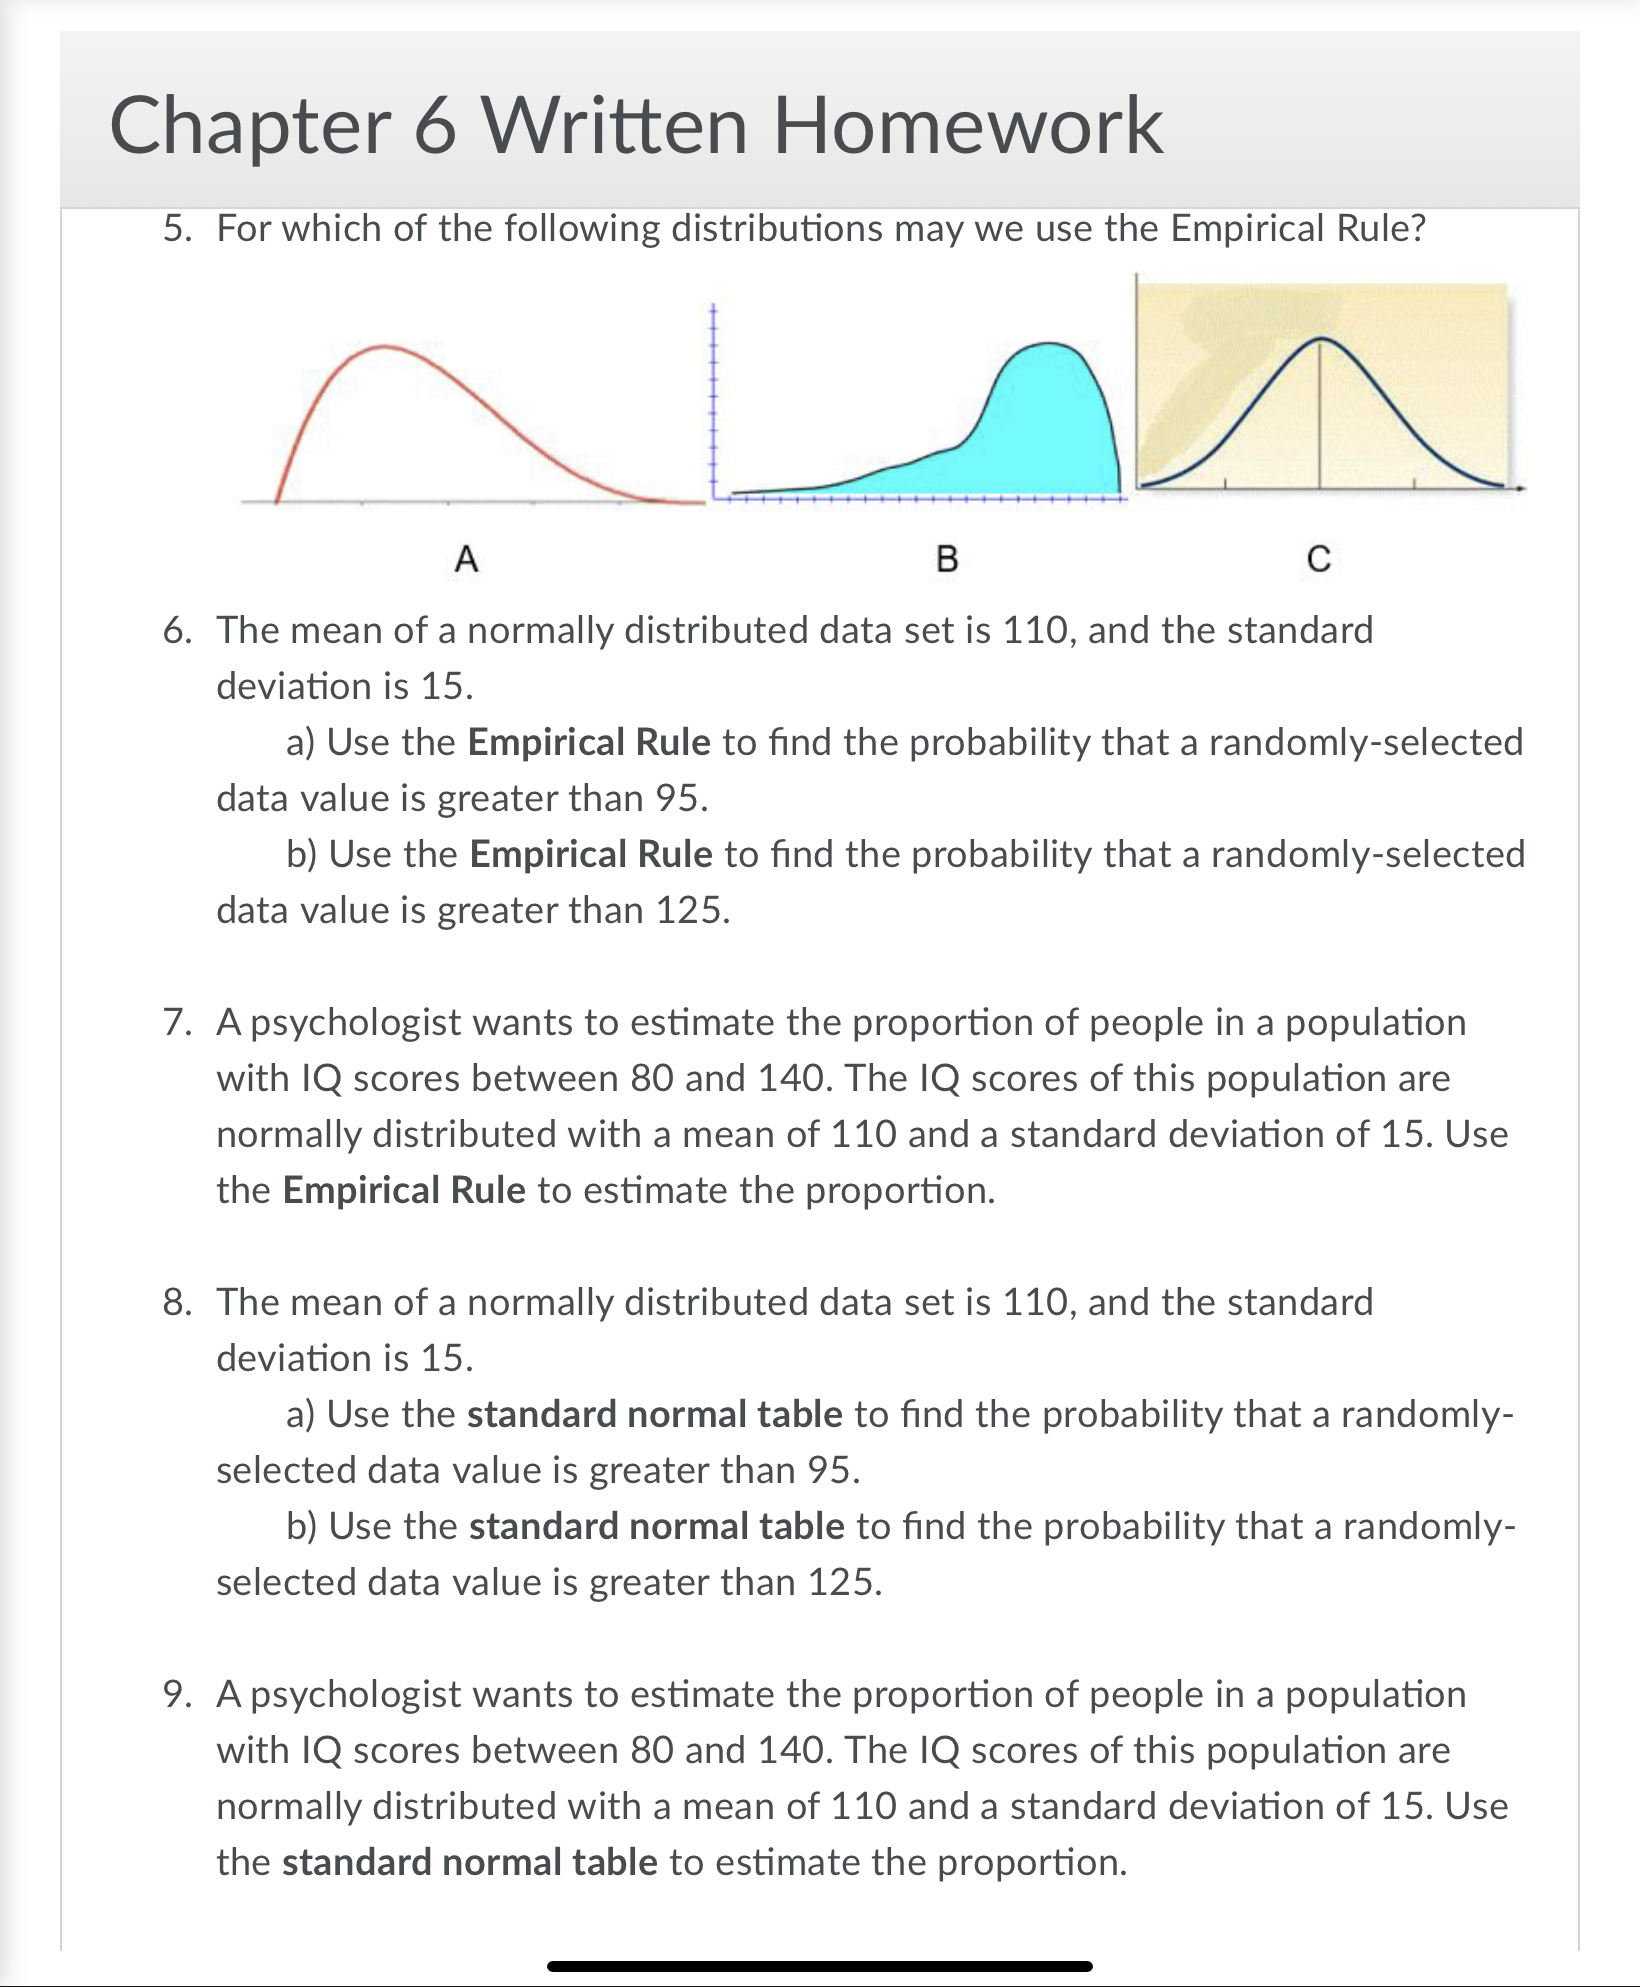
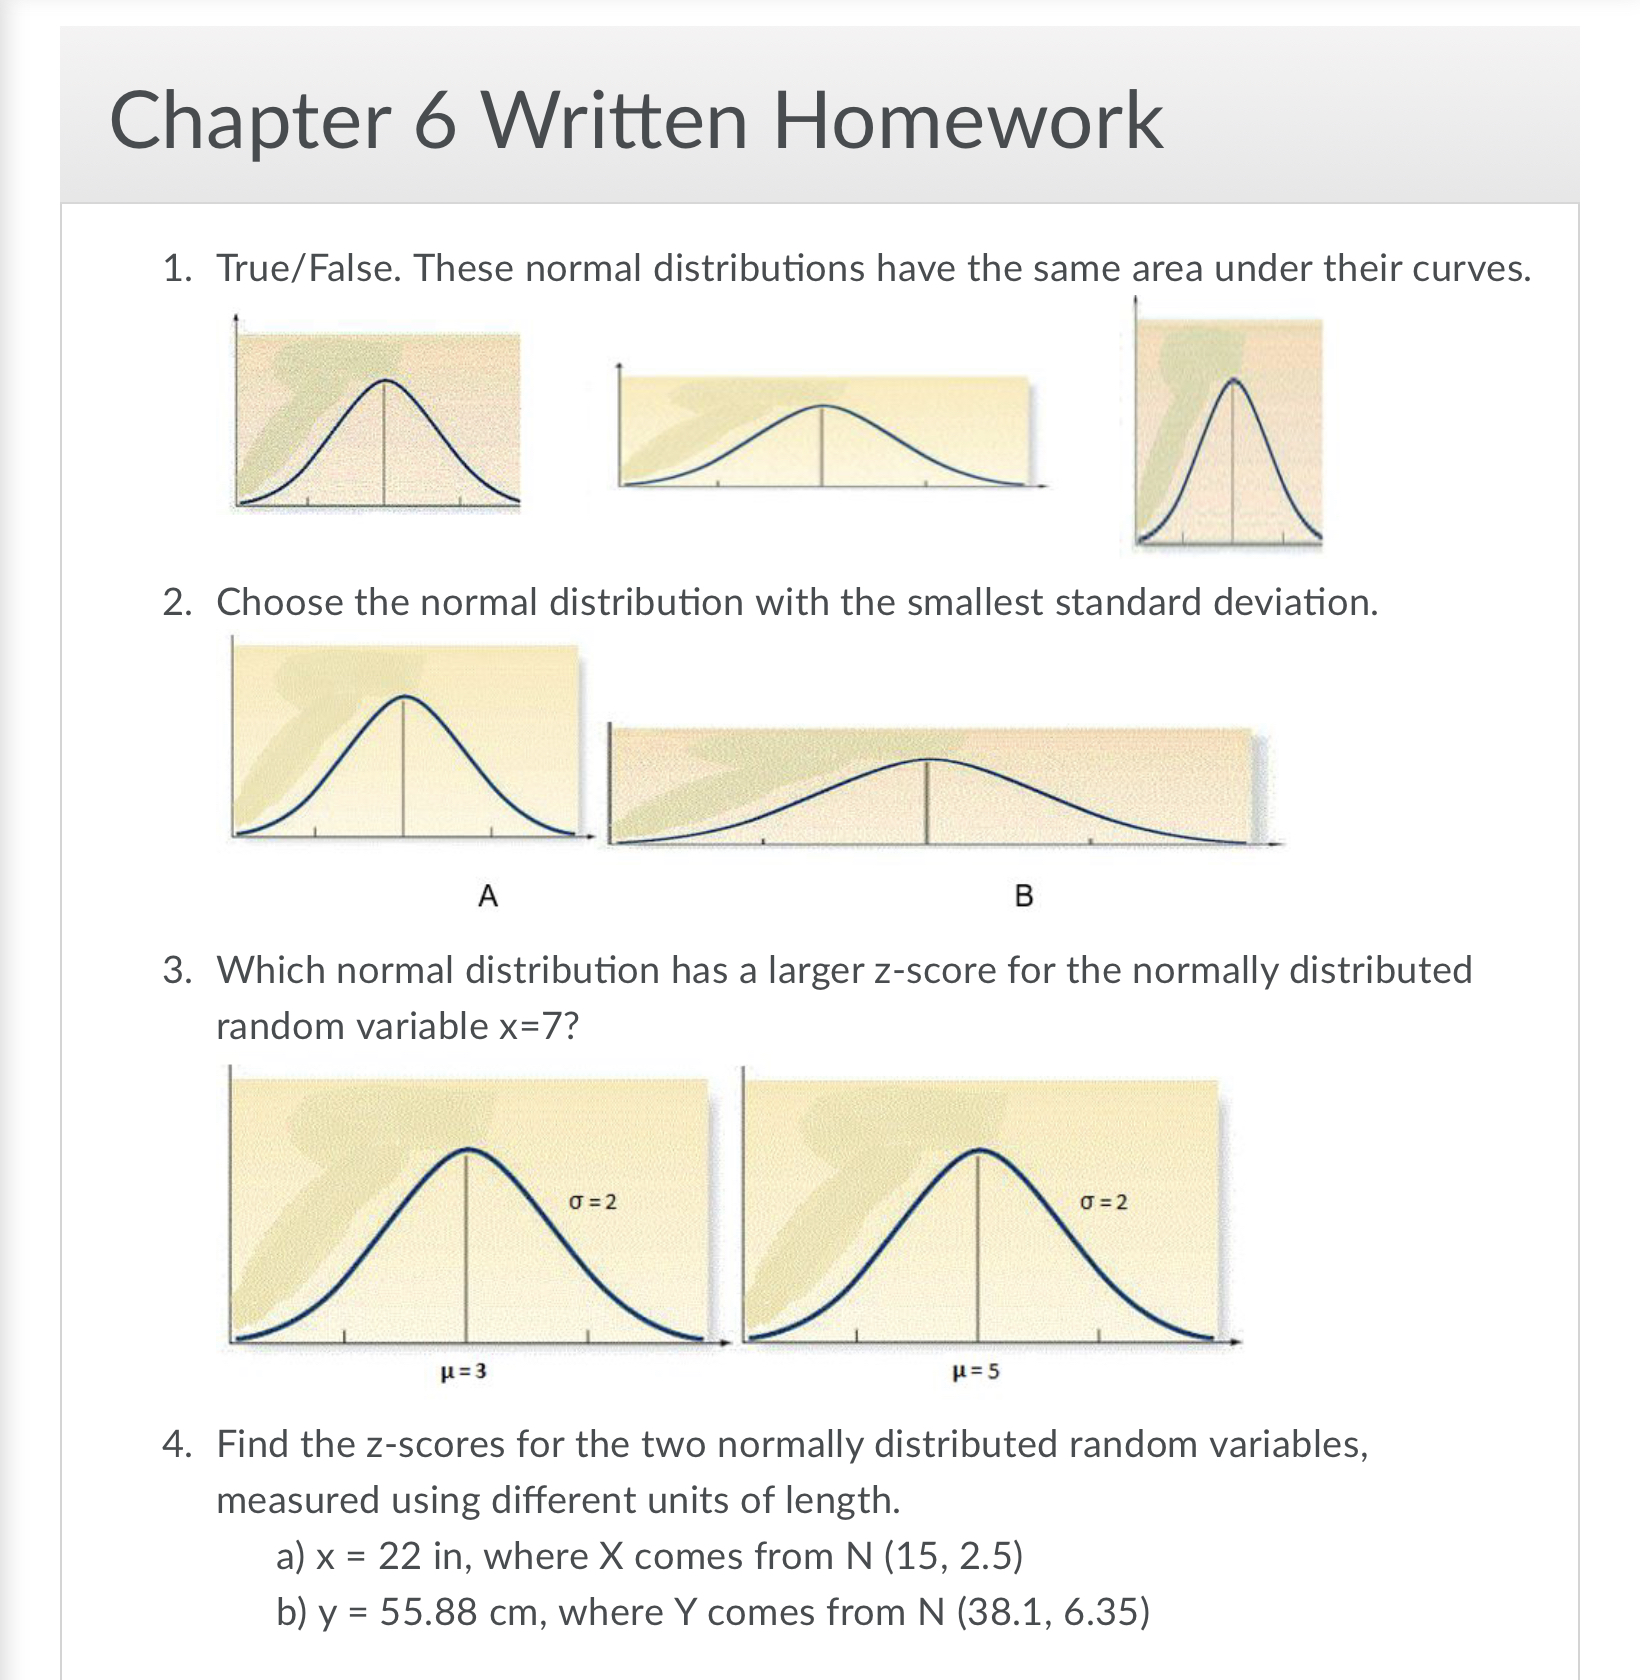
Chapter 6 Written Homework 5. For which of the following distributions may we use the Empirical Rule? A B C 6. The mean of a normally distributed data set is 110, and the standard deviation is 15. a) Use the Empirical Rule to nd the probability that a randomly-selected data value is greater than 95. b) Use the Empirical Rule to nd the probability that a randomly-selected data value is greater than 125. 7. A psychologist wants to estimate the proportion of people in a population with IQ scores between 80 and 140. The IQ scores of this population are normally distributed with a mean of 110 and a standard deviation of 15. Use the Empirical Rule to estimate the proportion. 8. The mean of a normally distributed data set is 110, and the standard deviation is 15. a) Use the standard normal table to nd the probability that a randomly- selected data value is greater than 95. b) Use the standard normal table to nd the probability that a randomly- selected data value is greater than 125. 9. A psychologist wants to estimate the proportion of people in a population with IQ scores between 80 and 140. The IQ scores of this population are normally distributed with a mean of 110 and a standard deviation of 15. Use the standard normal table to estimate the proportion. Chapter 6 Written Homework 1. True/False. These normal distributions have the same area under their curves. 2. Choose the normal distribution with the smallest standard deviation. A B 3. Which normal distribution has a larger z-score for the normally distributed random variable x=7? U 2 II I123 \"=5 4. Find the z-scores for the two normally distributed random variables, measured using different units of length. a) x = 22 in, where X comes from N (15, 2.5) b) y = 55.88 cm, where Y comes from N (38.1, 6.35) Chapter 6 Written Homework 9. A psychologist wants to estimate the proportion of people in a population with IQ scores between 80 and 140. The IQ scores of this population are normally distributed with a mean of 110 and a standard deviation of 15. Use the standard normal table to estimate the proportion. 10. Why are your answers to questions 8 and 9 not identical to your answers to questions 6 and 7, respectively? 11. The mean of a normally distributed data set is 118, and the standard deviation is 16. a) Use the standard normal table to nd the probability that a randomly- selected data value is greater than 140. b) Use the standard normal table to nd the probability that a randomly- selected data value is less than 90