Answered step by step
Verified Expert Solution
Link Copied!

Question

1 Approved Answer

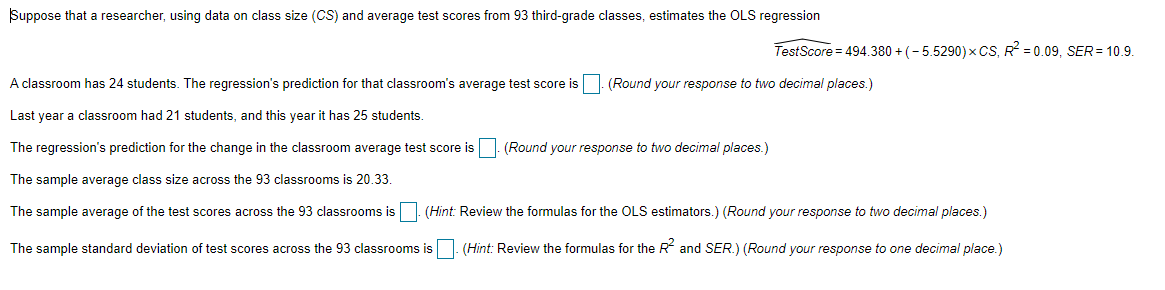
Please see attached question. Suppose that a researcher, using data on class size (CS) and average test scores from 93 thirdgrade classes. estimates the OLS

Please see attached question.

image text in transcribed
Suppose that a researcher, using data on class size (CS) and average test scores from 93 thirdgrade classes. estimates the OLS regression _..--.__ TesfSoore= 494.380 + ( 5.5290) X OS, R2 = 0.09, SE? =1U.9. Aclassroom has 24 students. The regression's prediction for that classroom's average test score is (Round your response to two decimai pieces.) Last year a classroom had 21 students, and this year it has 25 students. The regression's prediction for the change in the classroom average test score is . (Round yourresponse to two decimai pieces.) The sample average dass size across the 93 classroom ls 2t] 33 The sample average of the test scores across the 93 classrooms is . (Hint: Review the fonTIulas for the OLS estimators.) (Round your response to two decimat pieces.) The sample standard deviation of test scores across the 93 classrooms is . (Hint: Review the formulas for the R2 and BER.) [Round your response to one decimai place.)

Step by Step Solution

There are 3 Steps involved in it

Step: 1

blur-text-image

Get Instant Access to Expert-Tailored Solutions

See step-by-step solutions with expert insights and AI powered tools for academic success

Step: 2

blur-text-image

Step: 3

blur-text-image

Ace Your Homework with AI

Get the answers you need in no time with our AI-driven, step-by-step assistance

Get Started

Recommended Textbook for

Economics The Basics

Authors: Michael Mandel

2nd Edition

0073523186, 9780073523187

More Books

Students also viewed these Economics questions