Answered step by step
Verified Expert Solution
Link Copied!

Question

1 Approved Answer

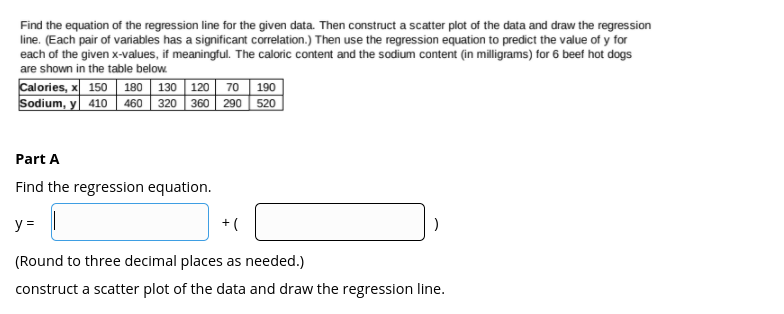
please see screen shot for question. Find the equation of the regression line for the given data. Then construct a scatter plot of the data

please see screen shot for question.

image text in transcribed
Find the equation of the regression line for the given data. Then construct a scatter plot of the data and draw the regression line. (Each pair of variables has a significant correlation.) Then use the regression equation to predict the value of y for each of the given x-values, if meaningful. The caloric content and the sodium content (in milligrams) for 6 beef hot dogs are shown in the table below. Calories, X 150 180 130 120 70 190 Sodium, y 410 460 320 360 290 520 Part A Find the regression equation. Y= + (Round to three decimal places as needed.) construct a scatter plot of the data and draw the regression line

Step by Step Solution

There are 3 Steps involved in it

Step: 1

blur-text-image

Get Instant Access to Expert-Tailored Solutions

See step-by-step solutions with expert insights and AI powered tools for academic success

Step: 2

blur-text-image

Step: 3

blur-text-image

Ace Your Homework with AI

Get the answers you need in no time with our AI-driven, step-by-step assistance

Get Started

Recommended Textbook for

Quantitative Analysis For Management

Authors: Barry Render, Ralph M. Stair, Michael E. Hanna

11th Edition

9780132997621, 132149117, 132997622, 978-0132149112

Students also viewed these Mathematics questions