Question
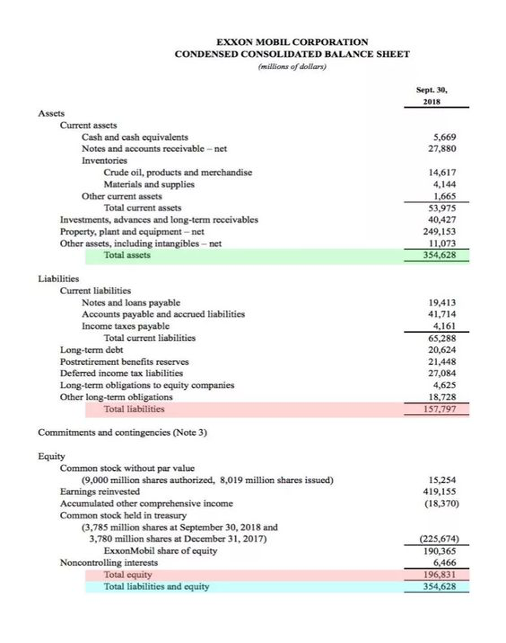
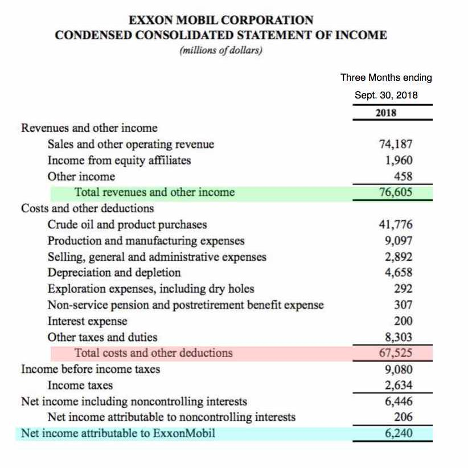
Please see the attached financial statement and apply the analytical tools to analyze a companys financial position. Please complete the following: [1] Return on Asset:


Please see the attached financial statement and apply the analytical tools to analyze a companys financial position.
Please complete the following:
[1] Return on Asset:
ROA = (net income) + ( 1 tax rate)(interest exp) + minority interest in earning
Average Total Assets
[2] Disaggregating ROA :
ROA = Profit margin for ROA x Asset Turnover
NI + Int. Exp + NI + Int. Exp.+ Sale
Minority int. in = minority int. in x
earning earnings
average total sales average total assets
assets
[3] Return on Common Equity :
ROCE = Net income -- preferred stock dividend / average common stockholders equity
[4] Disaggregating ROCE
ROCE = profit margin for ROCE x Assets Turnover x Capital Structure Leverage
Net income to Common x Sales x Average Total Assets
Sales Average total Assets Average Common
Shareholders Equity
[5] Please provide the interpretation to support your analysis.
EXXON MOBIL CORPORATION CONDENSED CONSOLIDATED BALANCE SHEET millions of dollars) Sept. 30 2018 Assets 5,669 27,880 Current assets Cash and cash equivalents Notes and accounts receivable -net Inventories Crude oil, products and merchandise Materials and supplies Other current assets Total current assets Investments, advances and long-term receivables Property, plant and equipment - net Other assets, including intangibles - net Total assets 14,617 4,144 1,665 53.975 40,427 249,153 11,073 354,628 Liabilities Current liabilities Notes and loans payable Accounts payable and accrued liabilities Income taxes payable Total current liabilities Long-term debt Postretirement benefits reserves Deferred income tax liabilities Long-term obligations to equity companies Other long-term obligations Total liabilities 19,413 41,714 4,161 65,288 20,624 21,448 27,084 4,625 18,728 157.797 Commitments and contingencies (Note 3) Equity Common stock without par value (9,000 million shares authorized, 8,019 million shares issued) Earnings reinvested Accumulated other comprehensive income Common stock held in treasury (3.785 million shares at September 30, 2018 and 3,780 million shares at December 31, 2017) ExxonMobil share of equity Noncontrolling interests Total equity Total liabilities and equity 15,254 419,155 (18,370) (225,674) 190.365 6,466 196,831 354,628 EXXON MOBIL CORPORATION CONDENSED CONSOLIDATED STATEMENT OF INCOME (millions of dollars) Three Months ending Sept. 30, 2018 2018 74,187 1,960 458 76,605 Revenues and other income Sales and other operating revenue Income from equity affiliates Other income Total revenues and other income Costs and other deductions Crude oil and product purchases Production and manufacturing expenses Selling, general and administrative expenses Depreciation and depletion Exploration expenses, including dry holes Non-service pension and postretirement benefit expense Interest expense Other taxes and duties Total costs and other deductions Income before income taxes Income taxes Net income including noncontrolling interests Net income attributable to noncontrolling interests Net income attributable to ExxonMobil 41,776 9,097 2,892 4,658 292 307 200 8,303 67,525 9,080 2,634 6,446 206 6,240 EXXON MOBIL CORPORATION CONDENSED CONSOLIDATED BALANCE SHEET millions of dollars) Sept. 30 2018 Assets 5,669 27,880 Current assets Cash and cash equivalents Notes and accounts receivable -net Inventories Crude oil, products and merchandise Materials and supplies Other current assets Total current assets Investments, advances and long-term receivables Property, plant and equipment - net Other assets, including intangibles - net Total assets 14,617 4,144 1,665 53.975 40,427 249,153 11,073 354,628 Liabilities Current liabilities Notes and loans payable Accounts payable and accrued liabilities Income taxes payable Total current liabilities Long-term debt Postretirement benefits reserves Deferred income tax liabilities Long-term obligations to equity companies Other long-term obligations Total liabilities 19,413 41,714 4,161 65,288 20,624 21,448 27,084 4,625 18,728 157.797 Commitments and contingencies (Note 3) Equity Common stock without par value (9,000 million shares authorized, 8,019 million shares issued) Earnings reinvested Accumulated other comprehensive income Common stock held in treasury (3.785 million shares at September 30, 2018 and 3,780 million shares at December 31, 2017) ExxonMobil share of equity Noncontrolling interests Total equity Total liabilities and equity 15,254 419,155 (18,370) (225,674) 190.365 6,466 196,831 354,628 EXXON MOBIL CORPORATION CONDENSED CONSOLIDATED STATEMENT OF INCOME (millions of dollars) Three Months ending Sept. 30, 2018 2018 74,187 1,960 458 76,605 Revenues and other income Sales and other operating revenue Income from equity affiliates Other income Total revenues and other income Costs and other deductions Crude oil and product purchases Production and manufacturing expenses Selling, general and administrative expenses Depreciation and depletion Exploration expenses, including dry holes Non-service pension and postretirement benefit expense Interest expense Other taxes and duties Total costs and other deductions Income before income taxes Income taxes Net income including noncontrolling interests Net income attributable to noncontrolling interests Net income attributable to ExxonMobil 41,776 9,097 2,892 4,658 292 307 200 8,303 67,525 9,080 2,634 6,446 206 6,240Step by Step Solution
There are 3 Steps involved in it
Step: 1

Get Instant Access to Expert-Tailored Solutions
See step-by-step solutions with expert insights and AI powered tools for academic success
Step: 2

Step: 3

Ace Your Homework with AI
Get the answers you need in no time with our AI-driven, step-by-step assistance
Get Started


