Please see the attached question (easier to read that way)
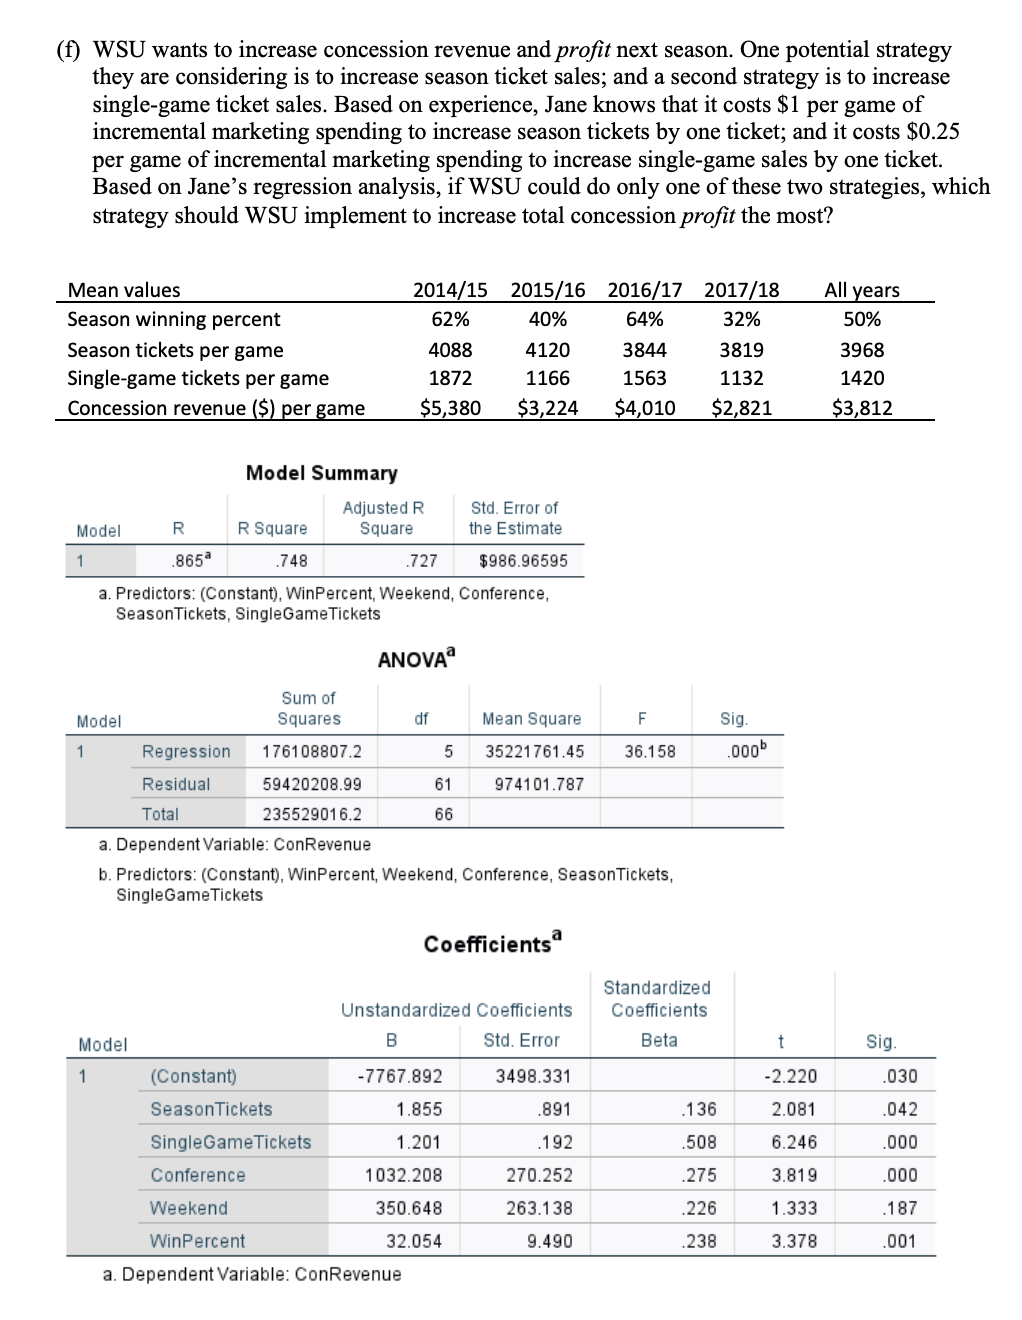
Western State University (WSU) Men's Basketball Team competes in the Pacific Mountain Conference, along with teams from eight other universities. Each team in the conference plays every other team in the conference twice per year, with one game played on each team's campus. In addition, WSU can host additional games against teams outside its conference each year. Overall, WSU usually hosts 16 to 21 games on its campus each year. WSU's home games generate revenues for the athletic department through ticket sales and concession sales (food and drinks). WSU sells season tickets each year, as well as tickets to single games. Jane Clifford, WSU's marketing analyst, is forecasting concession sales for next year using linear regression and data she has gathered from the past four years. She expects that concession sales for each game will be influenced by how many season tickets have been sold, how many single game tickets have been sold, how well the team is playing that season (i.e., their winning percent), whether they are playing a team in their own conference or outside their conference, as well as whether or not the game date falls on a weekend. Variable Description ConRevenue Concession sales revenue ($) Season Tickets Number of Season Tickets Sold SingleGame Tickets Number of Single Game Tickets Sold Conference Conference Opponent? (0=Non-Conference, 1=Conference) Weekend Weekend Game? (0=Weekday, 1=Weekend) WinPercent Win Percentage (0-100) The results of Jane's regression analysis, including some descriptive statistics, are summarized on the next page. Answer the following questions, based on those results. Be very specific and detailed in your answers. Include specific numbers from the results in your answers and a = .05 for all significance tests. (a) Assess the overall model fit. Is it statistically significant? Discuss specific numbers in your answer. (b) How well does the regression model explain variation in concession sales? Discuss specific numbers in your answer. (c) Report the estimated coefficient values for each independent variable, include whether each is significantly different from zero, and interpret each coefficient value's meaning. Discuss specific numbers in your answer. (d) Predict what the concession revenues would be for a game played on a weekday against a conference team, with game attendance and a season winning percentage that's the same as the average values for the 2017/2018 season (use the table). (e) During the 2017-2018 season the team only won 32% of their games so the coach was fired. WSU hired a new coach and expects the percentage of games won to be 55% next year. How much do you predict concessions revenue to increase with a 23% point increase in games won?(f) WSU wants to increase concession revenue and profit next season. One potential strategy they are considering is to increase season ticket sales; and a second strategy is to increase single-game ticket sales. Based on experience, Jane knows that it costs $1 per game of incremental marketing spending to increase season tickets by one ticket; and it costs $0.25 per game of incremental marketing spending to increase single-game sales by one ticket. Based on Jane's regression analysis, if WSU could do only one of these two strategies, which strategy should WSU implement to increase total concession profit the most? Mean values 2014/15 2015/16 2016/17 2017/18 All years Season winning percent 62% 40% 64% 32% 50% Season tickets per game 4088 4120 3844 3819 3968 Single-game tickets per game 1872 1166 1563 1132 1420 Concession revenue ($) per game $5,380 $3,224 $4,010 $2,821 $3,812 Model Summary Adjusted R Std. Error of Model R R Square Square the Estimate 1 865 748 727 $986.96595 a. Predictors: (Constant), WinPercent, Weekend, Conference, SeasonTickets, SingleGame Tickets ANOVA Sum of Model Squares df Mean Square F Sig. 1 Regression 176108807.2 5 35221761.45 36.158 000 Residual 59420208.99 61 974101.787 Total 235529016.2 66 a. Dependent Variable: ConRevenue b. Predictors: (Constant), WinPercent, Weekend, Conference, SeasonTickets, SingleGame Tickets Coefficients Standardized Unstandardized Coefficients Coefficients Model B Std. Error Beta Sig. (Constant) -7767.892 3498.331 2.220 030 Season Tickets 1.855 .891 136 2.081 042 SingleGame Tickets 1.201 .192 508 6.246 000 Conference 1032.208 270.252 275 3.819 000 Weekend 350.648 263.138 226 1.333 187 WinPercent 32.054 9.490 238 3.378 001 a. Dependent Variable: ConRevenue