

Question
Please see the data and scatter plots in the provided attached docs. The actual regression equation calculated by a computer is as follows: Energy Expenditure
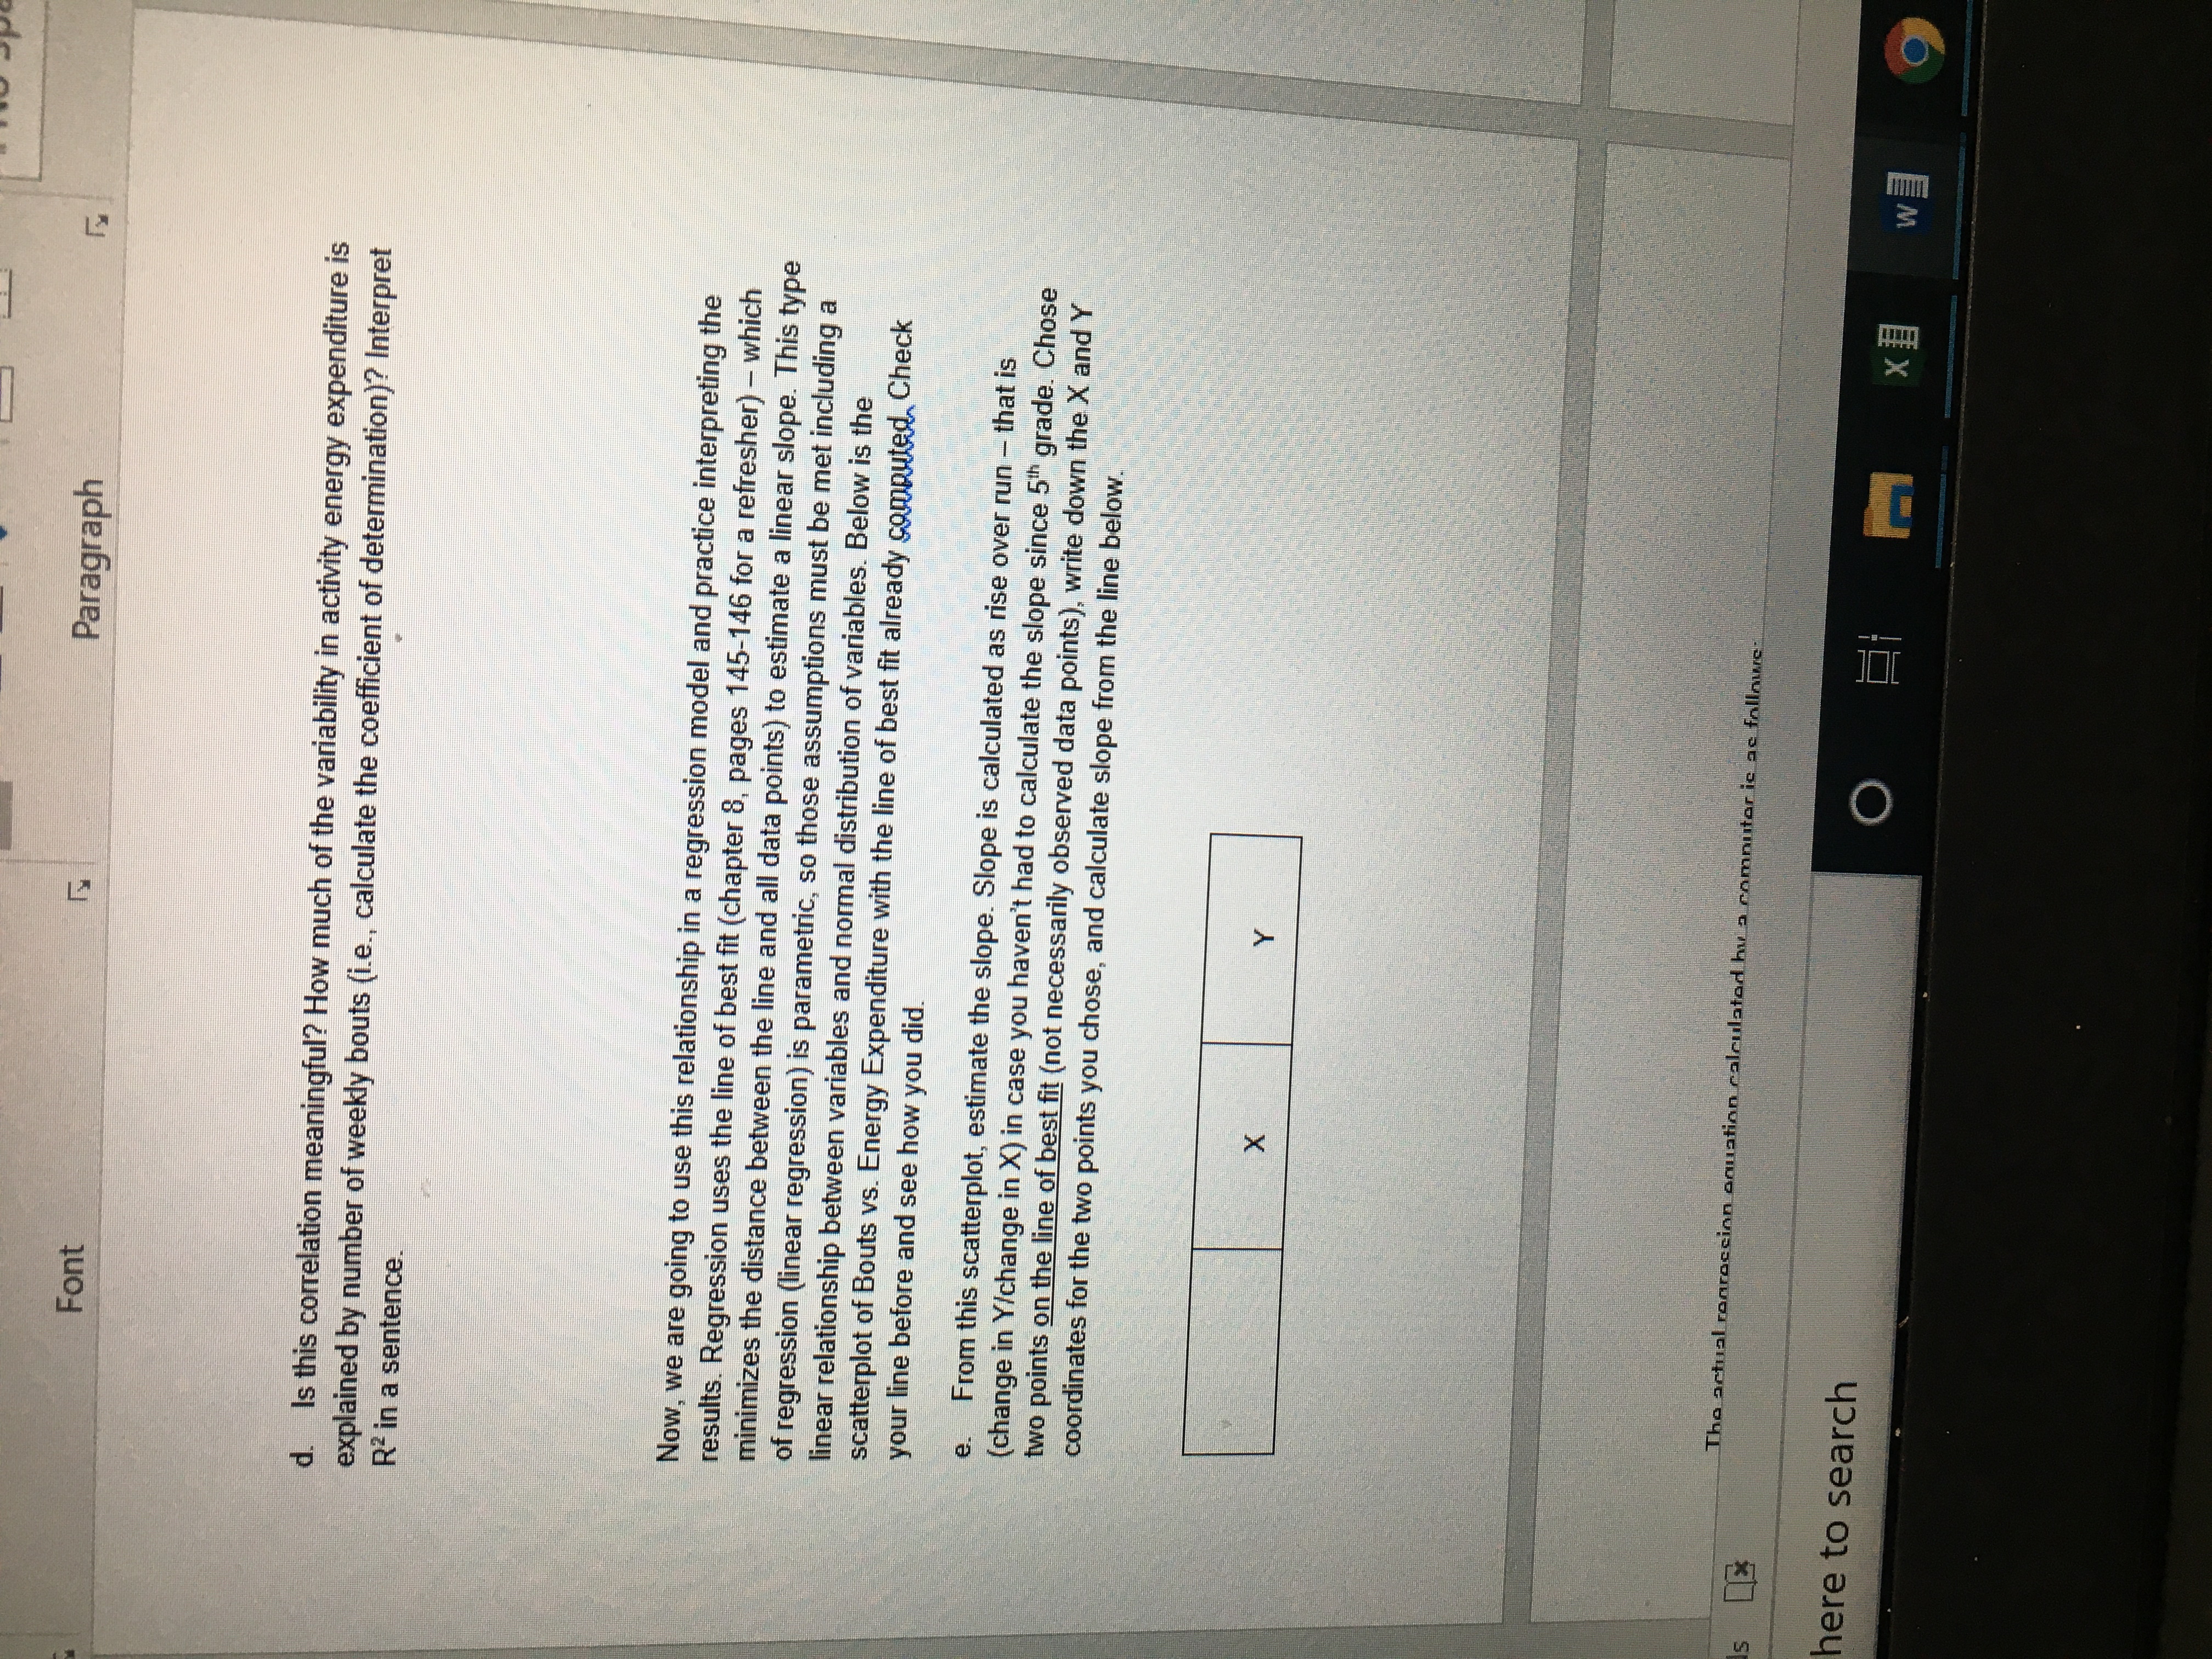
Please see the data and scatter plots in the provided attached docs.
The actual regression equation calculated by a computer is as follows:
Energy Expenditure (kcals/week) = -1480 + 1802 (number of bouts/week)
i. First, is this similar to the regression equation you calculated above?
j. Now, let's talk about interpreting and using this equation. First, describe what each of these values means?:
-1480:
1082:
k. Next, let's use this regression equation as a prediction equation. Calculate the predicted energy expenditure for an individual that gets 1) 2 bouts per week and 2) 5 bouts per week
l. Calculating the error surrounding these predictions is beyond the scope of this class, but we can comment on how good of a 'prediction' model we think it is. How well do you think the line fits the data in the scatterplot? Based on our coefficient of determination, how much variability in physical activity energy expenditure does bouts of exercise per week explain?
Now, we are going to move on to interpreting multivariate regression coefficients. We decide we think age may also explain some of the variability in energy expenditure per week.
m. When age is added to the prediction equation, we get the following:
Energy Expenditure (kcals/week) = -1100 + 909 (number of bouts/week) + -5(age)
Write out below how each of the following numbers could be interpreted:
-1100:
909:
-5:
n. Use this prediction equation to predict the number of bouts per week for 1) someone who gets 3 bouts per week and it 22 years old; and someone who gets 5 bouts per week and is 35 years old.
o. The R2 value for the univariate regression equation (bouts with energy expenditure) is the same as that for the simple Pearson's correlation (R2= 45%). When we add age to the model, the R2 increases to 51%. Remember R2 is interpreted as the amount of variability explained by the independent variable(s). Discuss whether adding age to the model (multivariate model with bouts/week and age as a covariate and R2=51%) appears to improve prediction of energy expenditure vs. the univariate models (bouts only, R2=45%).

Step by Step Solution
There are 3 Steps involved in it
Step: 1

Get Instant Access to Expert-Tailored Solutions
See step-by-step solutions with expert insights and AI powered tools for academic success
Step: 2

Step: 3
Ace Your Homework with AI
Get the answers you need in no time with our AI-driven, step-by-step assistance
Get Started
Algebra And Trigonometry
Authors: Cynthia Y Young
5th Edition
1119820898, 9781119820895