Answered step by step
Verified Expert Solution
Question
1 Approved Answer
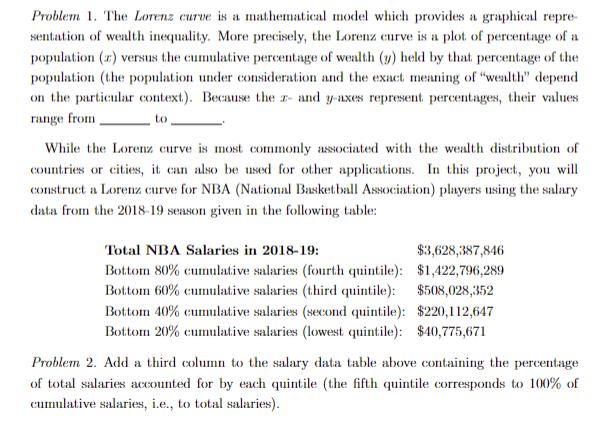
Please show all correct MATLAB code and work. Problem 1. The Lorenz curve is a mathematical model which provides a graphical repre- sentation of wealth


 Please show all correct MATLAB code and work.
 Problem 1. The Lorenz curve is a mathematical model which provides a graphical repre- sentation of wealth inequality. More precisely, the Lorenz curve is a plot of percentage of a population (z) versus the cumulative percentage of wealth (y) held by that percentage of the population (the population under consideration and the exact meaning of "wealth" depend on the particular context). Because the z- and y-axes represent percentages, their values range from to While the Lorenz curve is most commonly associated with the wealth distribution of countries or cities, it can also be used for other applications. In this project, you will construct a Lorenz curve for NBA (National Basketball Association) players using the salary data from the 2018-19 season given in the following table: Total NBA Salaries in 2018-19: $3,628,387,846 $1,422,796,289 Bottom 80% cumulative salaries (fourth quintile): Bottom 60% cumulative salaries (third quintile): $508,028,352 Bottom 40% cumulative salaries (second quintile): $220,112,647 Bottom 20% cumulative salaries (lowest quintile): $40,775,671 Problem 2. Add a third column to the salary data table above containing the percentage of total salaries accounted for by each quintile (the fifth quintile corresponds to 100% of cumulative salaries, i.e., to total salaries).
Step by Step Solution
There are 3 Steps involved in it
Step: 1

Get Instant Access to Expert-Tailored Solutions
See step-by-step solutions with expert insights and AI powered tools for academic success
Step: 2

Step: 3

Ace Your Homework with AI
Get the answers you need in no time with our AI-driven, step-by-step assistance
Get Started


