

Please show all excel formulas in an excel doc attached please, images go from bottom to top in order
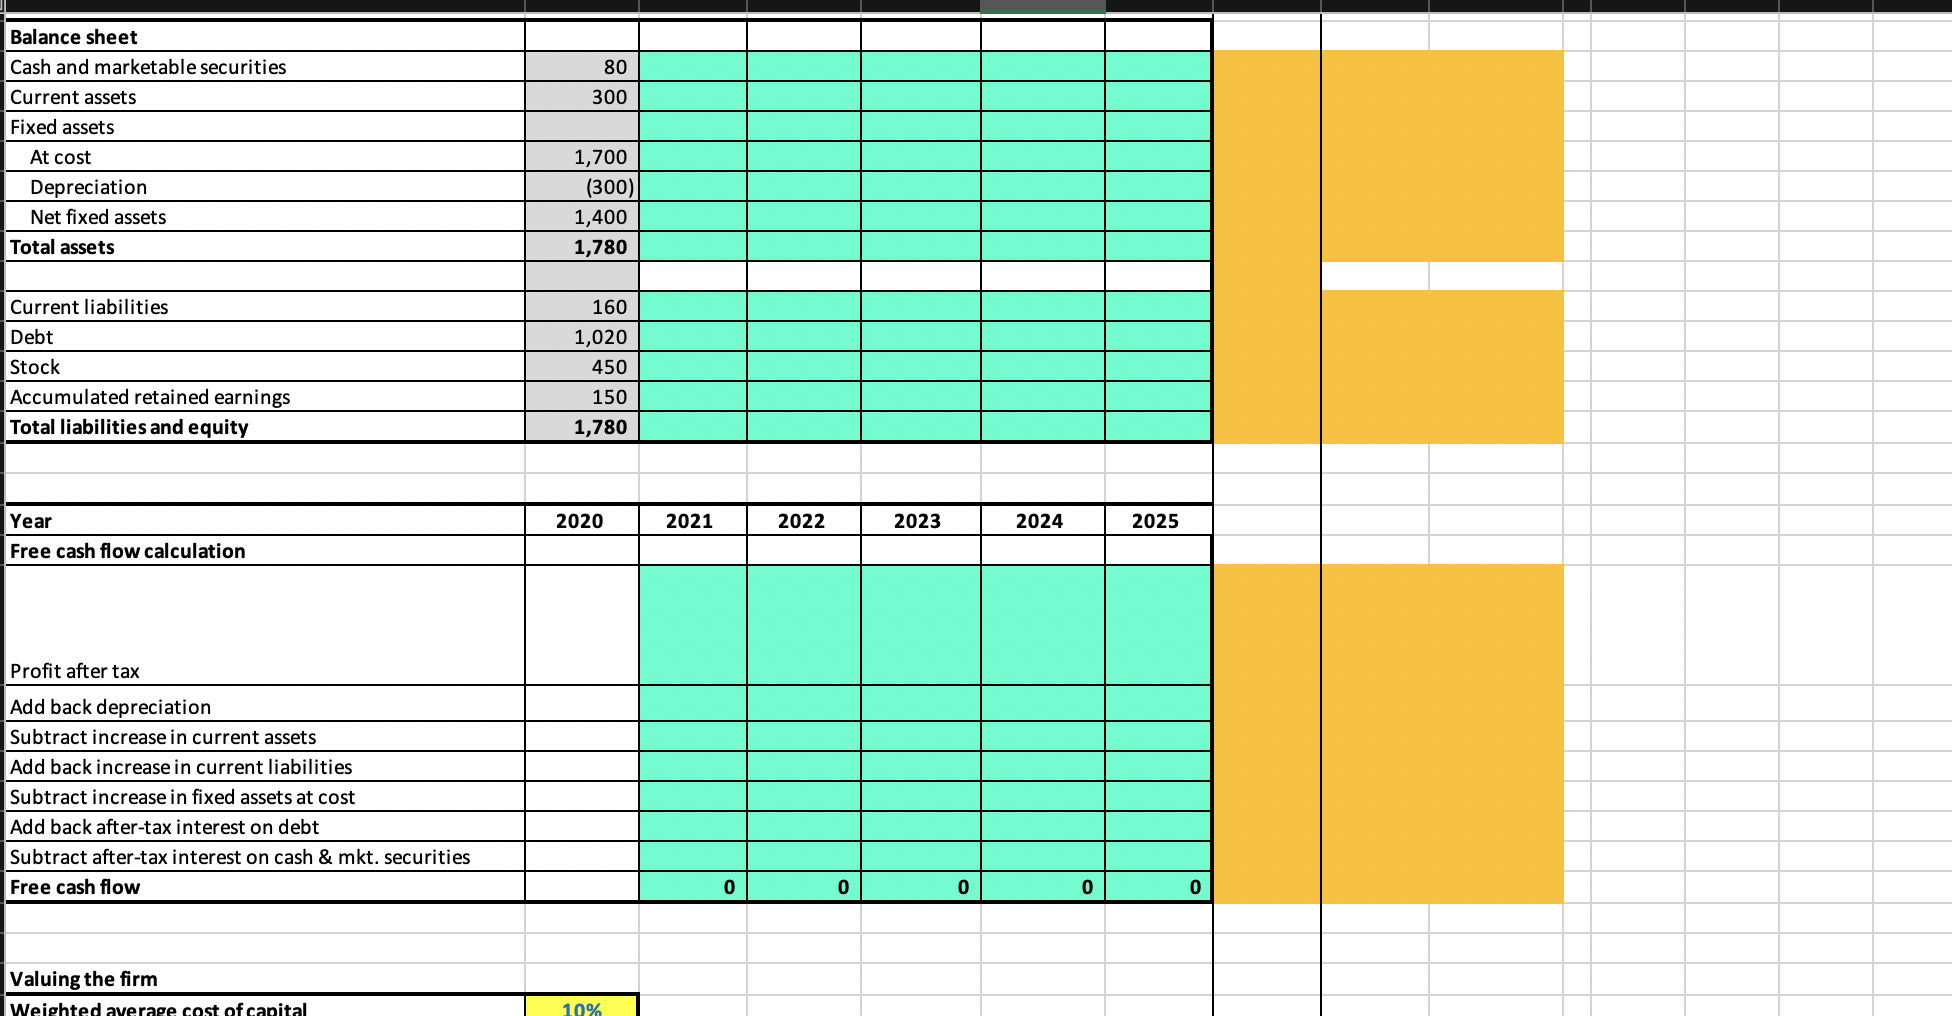
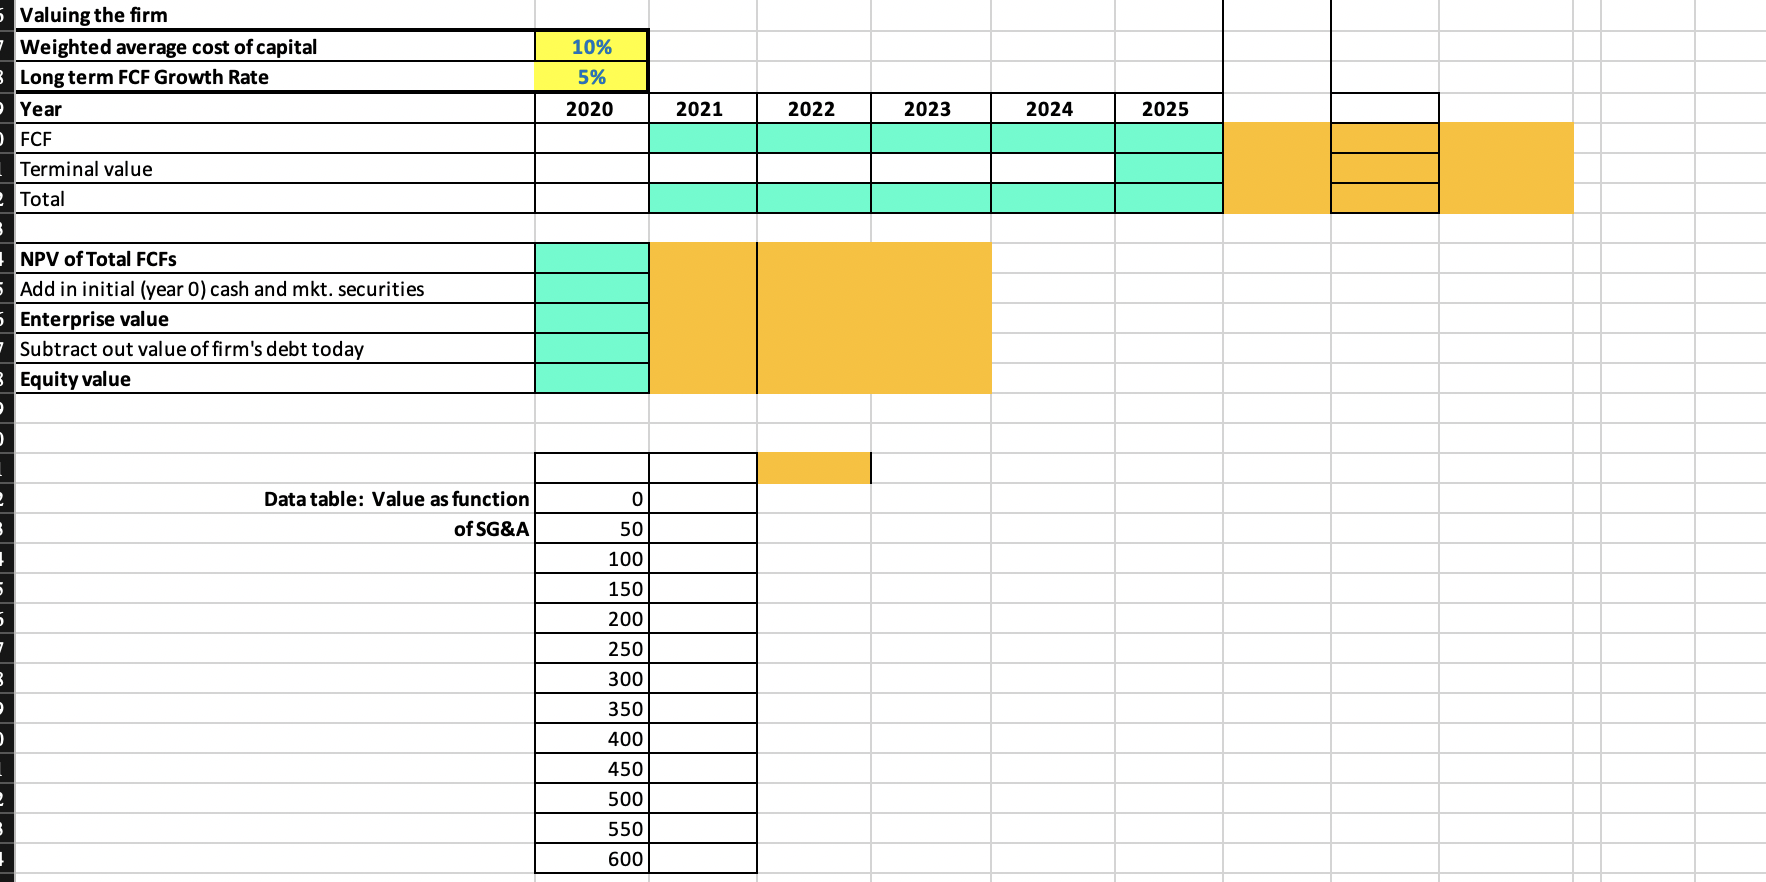
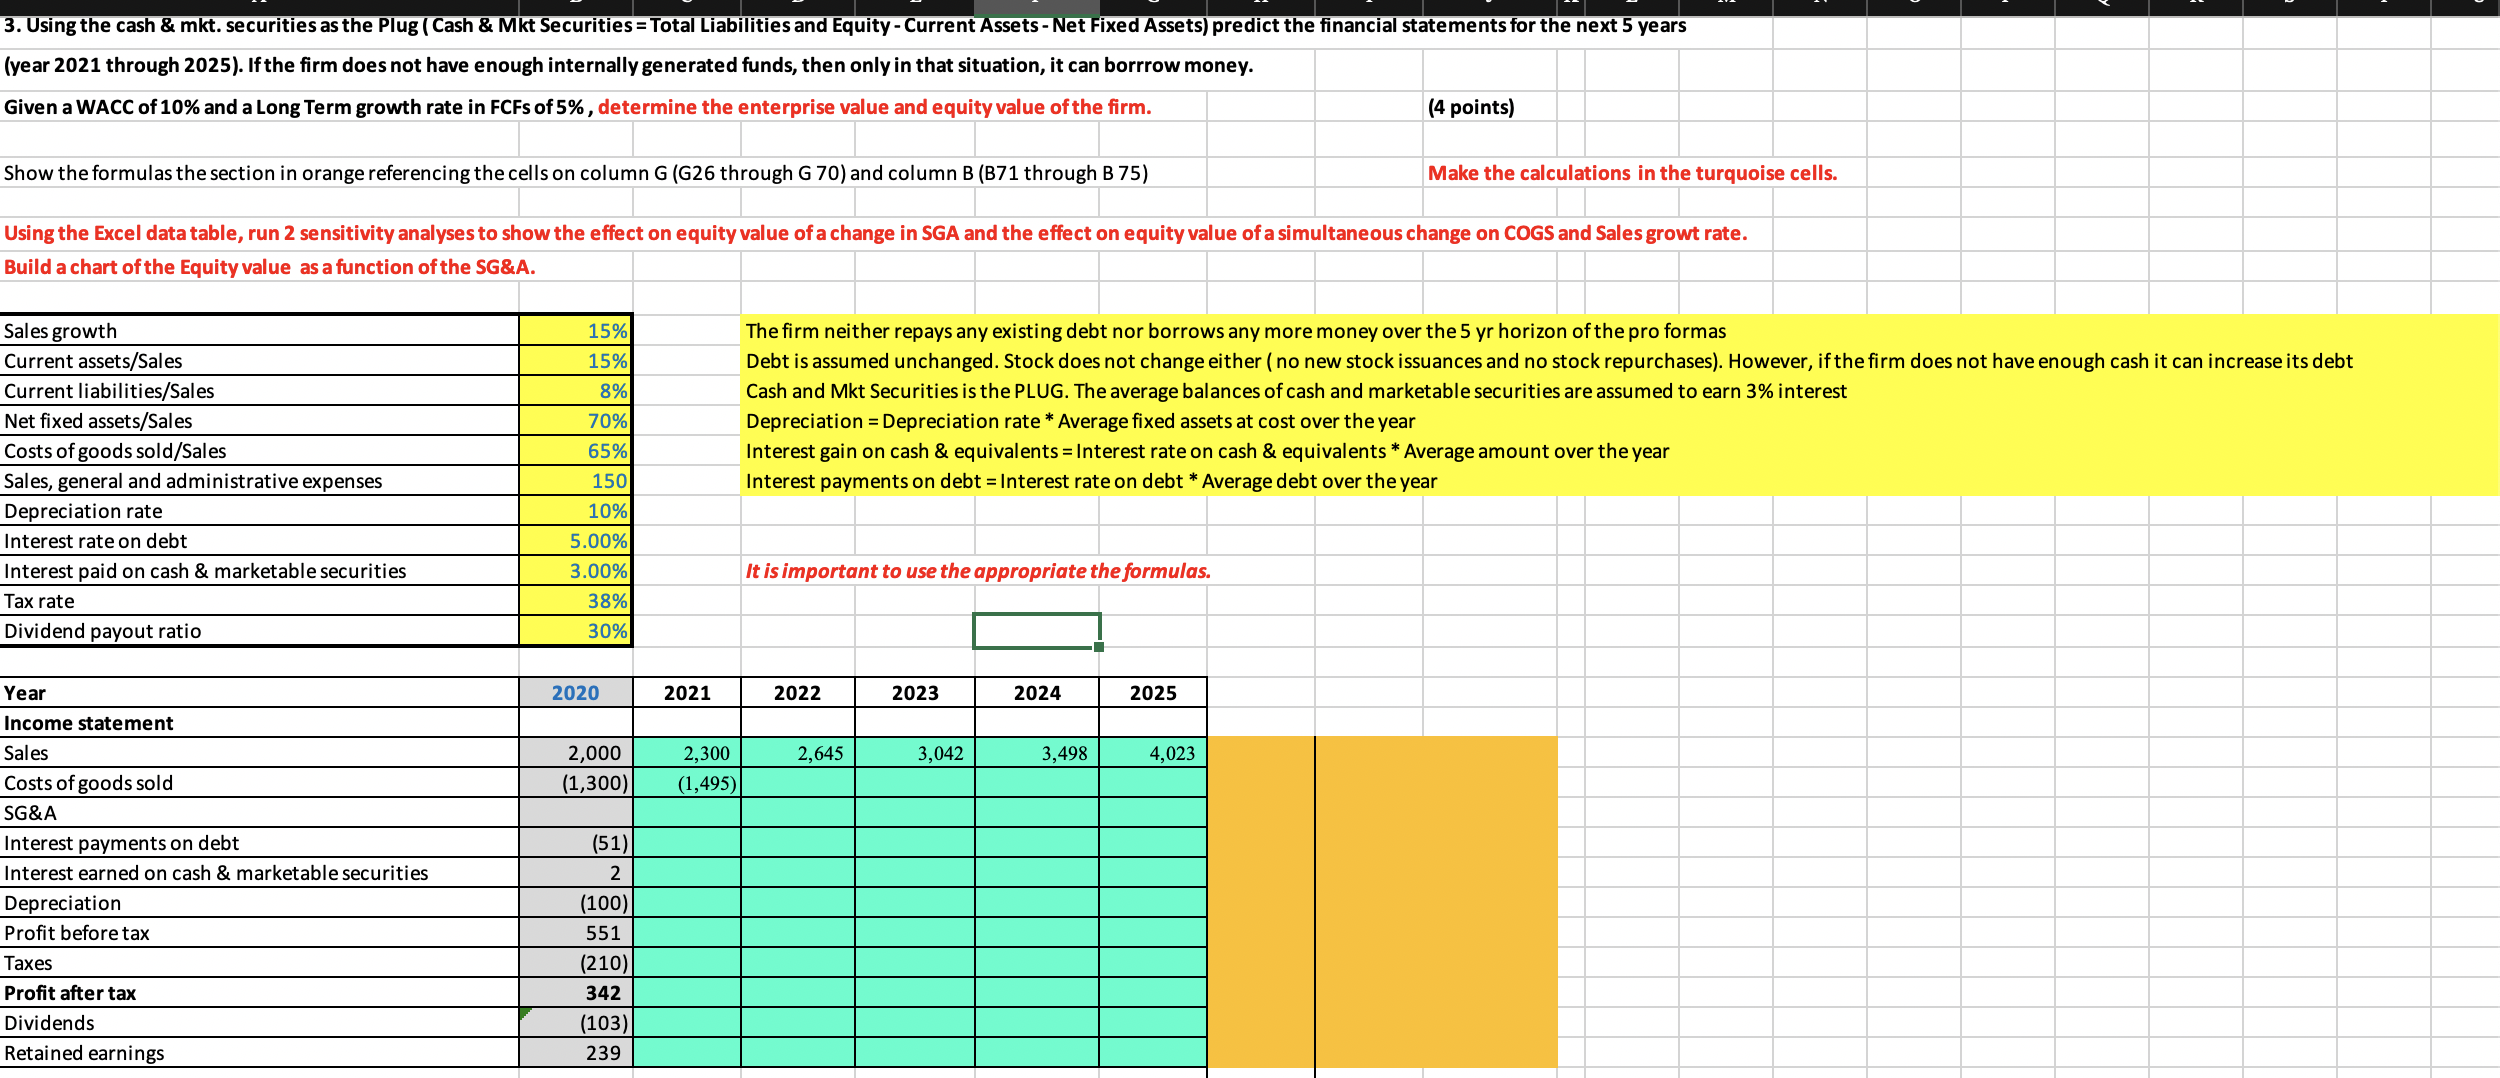
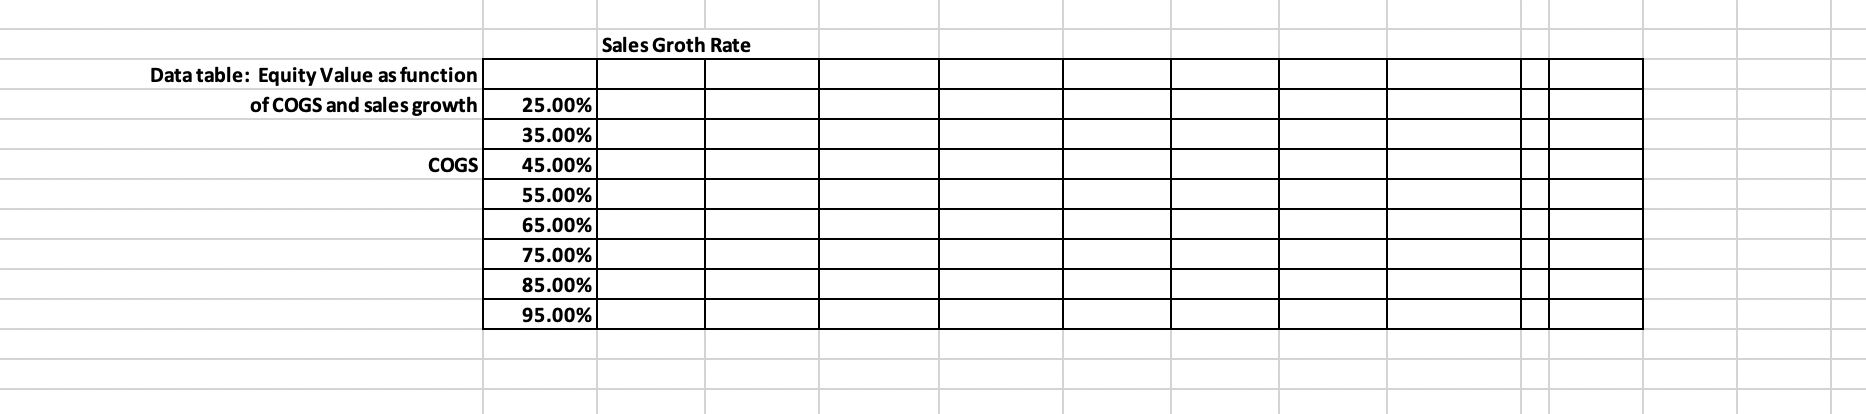
3. Using the cash & mkt. securities as the Plug ( Cash & Mkt Securities = Total Liabilities and Equity - Current Assets - Net Fixed Assets) predict the financial statements for the next 5 years (year 2021 through 2025). If the firm does not have enough internally generated funds, then only in that situation, it can borrow money. Given a WACC of 10% and a Long Term growth rate in FCFs of 5%, determine the enterprise value and equity value of the firm. (4 points) Show the formulas the section in orange referencing the cells on column G (G26 through G 70) and column B (B71 through B 75) Make the calculations in the turquoise cells. Using the Excel data table, run 2 sensitivity analyses to show the effect on equity value of a change in SGA and the effect on equity value of a simultaneous change on COGS and Sales growtrate. Build a chart of the Equity value as a function of the SG&A. Sales growth 15% The firm neither repays any existing debt nor borrows any more money over the 5 yr horizon of the pro formas Current assets/Sales 5% Debt is assumed unchanged. Stock does not change either ( no new stock issuances and no stock repurchases). However, if the firm does not have enough cash it can increase its debt Current liabilities/Sales 3% Cash and Mkt Securities is the PLUG. The average balances of cash and marketable securities are assumed to earn 3% interest Net fixed assets/Sales 70% Depreciation = Depreciation rate * Average fixed assets at cost over the year Costs of goods sold/Sales 65% Interest gain on cash & equivalents = Interest rate on cash & equivalents * Average amount over the year Sales, general and administrative expenses 150 Interest payments on debt = Interest rate on debt * Average debt over the year Depreciation rate 10% Interest rate on debt .00% Interest paid on cash & marketable securities 3.00% It is important to use the appropriate the formulas. Tax rate 38% Dividend payout ratio 30% Year 2020 2021 2022 2023 2024 2025 Income statement Sales 2,000 2,300 2,645 3,042 3,498 4,023 Costs of goods sold 1,300) (1,495) SG&A Interest payments on debt (51) Interest earned on cash & marketable securities Depreciation 100 Profit before tax 551 Taxes 210) Profit after tax 342 Dividends (103 Retained earnings 239Balance sheet Cash and marketable securities 80 Current assets 300 Fixed assets At cost 1,700 Depreciation 300) Net fixed assets 1,400 Total assets 1,780 Current liabilities 160 Debt 1,020 Stock 450 Accumulated retained earnings 150 Total liabilities and equity 1,780 Year 2020 2021 2022 2023 2024 2025 Free cash flow calculation Profit after tax Add back depreciation Subtract increase in current assets Add back increase in current liabilities Subtract increase in fixed assets at cost Add back after-tax interest on debt Subtract after-tax interest on cash & mkt. securities Free cash flow 0 0 0 0 0 Valuing the firmValuing the firm Weighted average cost of capital 10% Long term FCF Growth Rate 5% Year 2020 2021 2022 2023 2024 2025 FCF Terminal value Total NPV of Total FCFs Add in initial (year 0) cash and mkt. securities Enterprise value Subtract out value of firm's debt today Equity value Data table: Value as function 0 of SG&A 50 100 150 200 250 300 350 400 45 500 550 600Data table: Equity Value as function of COGS and sales growth COGS Sales Grath Rate 25.00% 35.00% 45.00% 55.00% 65.00% 75.00% 85.00% 95.00%