

Question
Please show all formulas used in Excel. Must show work, thank you. How do you not see these pictures? There is no excuse to not
Please show all formulas used in Excel. Must show work, thank you.
How do you not see these pictures? There is no excuse to not be able to answer this. Please show formulas used, thank you.
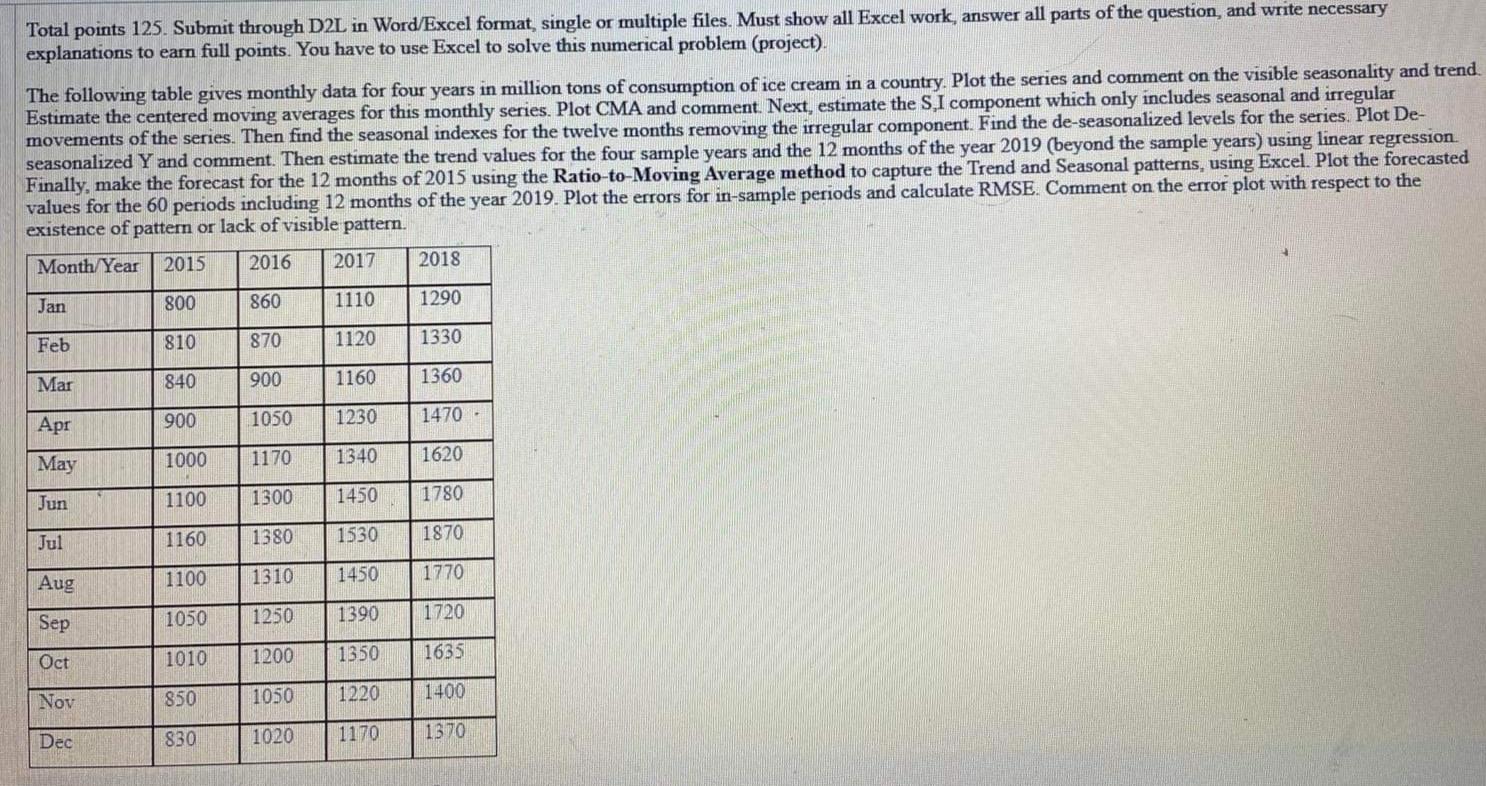
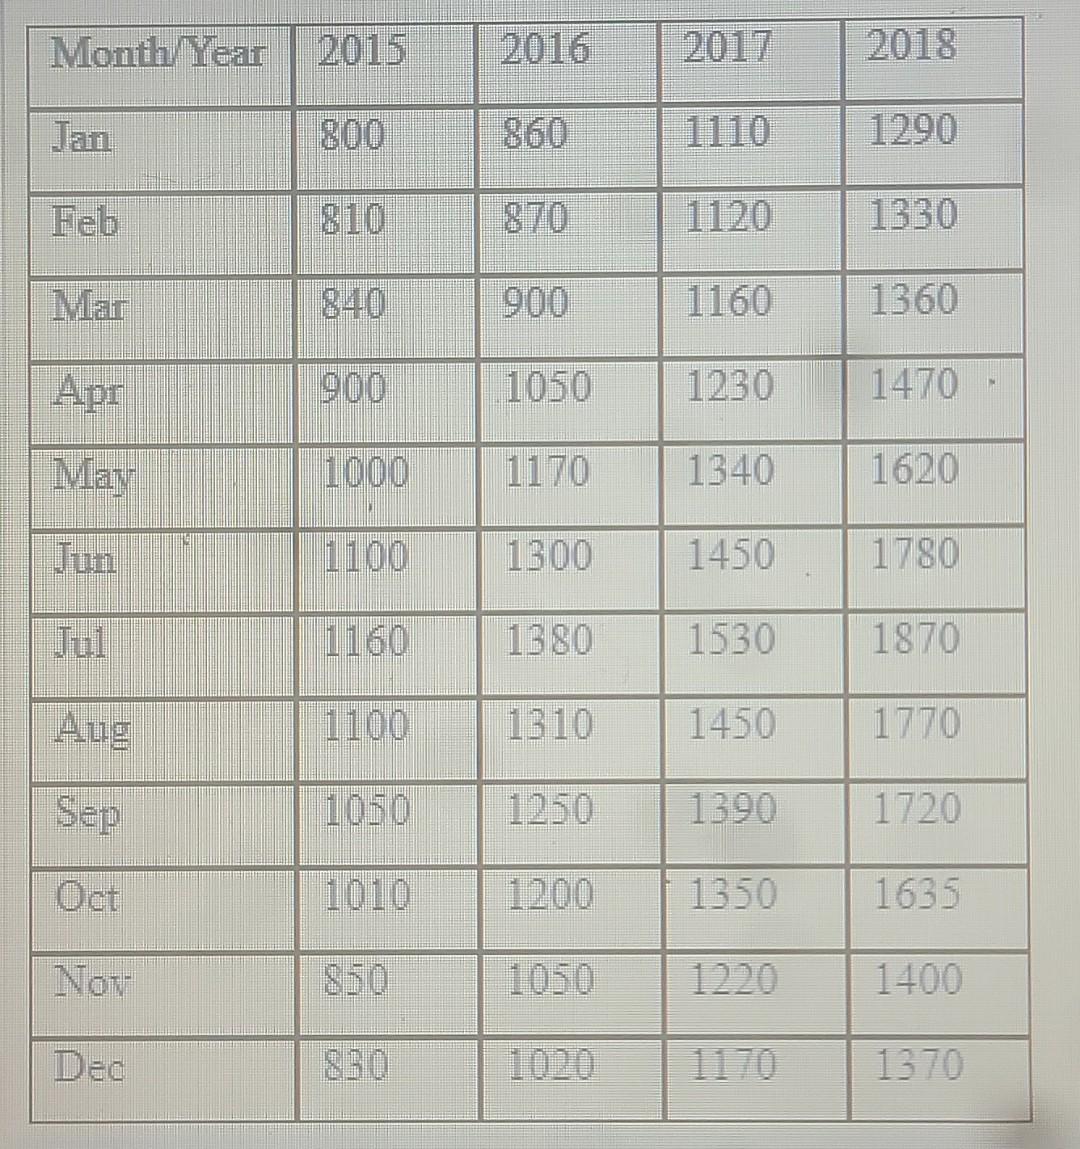
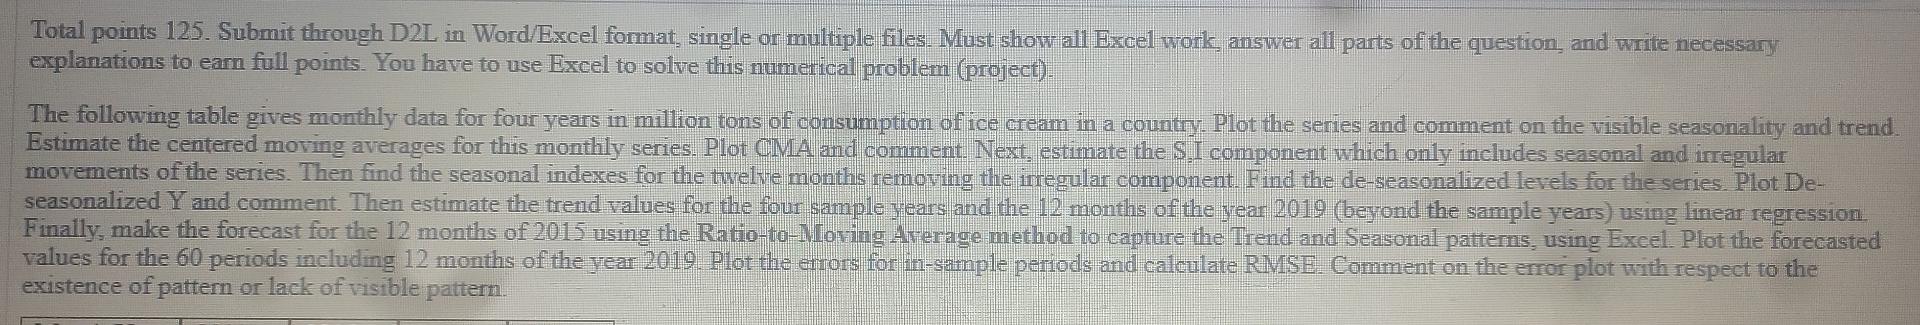
Total points 125. Submit through D2L in Word/Excel format, single or multiple files. Must show all Excel work, answer all parts of the question, and write necessary explanations to earn full points. You have to use Excel to solve this numerical problem (project). The following table gives monthly data for four years in million tons of consumption of ice cream in a country. Plot the series and comment on the visible seasonality and trend Estimate the centered moving averages for this monthly series. Plot CMA and comment. Next, estimate the SI component which only includes seasonal and irregular movements of the series. Then find the seasonal indexes for the twelve months removing the irregular component. Find the de-seasonalized levels for the series. Plot De- seasonalized Y and comment. Then estimate the trend values for the four sample years and the 12 months of the year 2019 (beyond the sample years) using linear regression. Finally, make the forecast for the 12 months of 2015 using the Ratio-to-Moving Average method to capture the Trend and Seasonal patterns, using Excel. Plot the forecasted values for the 60 periods including 12 months of the year 2019. Plot the errors for in-sample periods and calculate RMSE. Comment on the error plot with respect to the existence of pattern or lack of visible pattern. Month/Year 2015 2016 2017 2018 Jan 800 860 1110 1290 Feb 810 870 1120 1330 Mar 840 900 1160 1360 900 Apr 1230 1050 1470 May 1000 1170 1340 1620 1100 Jun 1300 1450 1780 1160 Jul 1380 1870 1530 Aug 1100 1310 1450 1770 1050 Sep 1250 1390 1720 Oct 1010 1200 1350 1635 Nov 850 1050 1220 1400 Dec 830 1020 1170 1370 Month Year 2015 2016 2018 Jan 800 860 1110 1290 Feb 870 1120 1330 Mar 900 1160 1360 Apr 900 1230 1470 Na 1000 1170 1340 1620 Tun 1100 1300 1450 1780 1160 1380 1530 1870 Aug 1100 1310 1450 1770 Sep 1050 1390 1720 Oct 1350 1635 Nov 1050 1220 1400 Dec 850 1170 1370 Total points 125. Submit through D2L in Word/Excel format, single or multiple files. Must show all Excel work, answer all parts of the question, and write necessary explanations to earn full points. You have to use Excel to solve this numerical problem (project). The following table gives monthly data for four years in million tons of consumption of ice cream in a country. Plot the series and comment on the visible seasonality and trend. Estimate the centered moving averages for this monthly series. Plot CMA and comment. Next, estimate the S.I component which only includes seasonal and irregular movements of the series. Then find the seasonal indexes for the twelve months removing the irregular component. Find the de-seasonalized levels for the series. Plot De- seasonalized Y and comment. Then estimate the trend values for the four sample years and the 12 months of the year 2019 (beyond the sample years) using linear regression Finally, make the forecast for the 12 months of 2015 using the Ratio-to-Moving Average method to capture the Trend and Seasonal patterns, using Excel. Plot the forecasted values for the 60 periods including 12 months of the year 2019. Plot the errors for in-sample periods and calculate RMSE. Comment on the error plot with respect to the existence of pattern or lack of visible pattern. Total points 125. Submit through D2L in Word/Excel format, single or multiple files. Must show all Excel work, answer all parts of the question, and write necessary explanations to earn full points. You have to use Excel to solve this numerical problem (project). The following table gives monthly data for four years in million tons of consumption of ice cream in a country. Plot the series and comment on the visible seasonality and trend Estimate the centered moving averages for this monthly series. Plot CMA and comment. Next, estimate the SI component which only includes seasonal and irregular movements of the series. Then find the seasonal indexes for the twelve months removing the irregular component. Find the de-seasonalized levels for the series. Plot De- seasonalized Y and comment. Then estimate the trend values for the four sample years and the 12 months of the year 2019 (beyond the sample years) using linear regression. Finally, make the forecast for the 12 months of 2015 using the Ratio-to-Moving Average method to capture the Trend and Seasonal patterns, using Excel. Plot the forecasted values for the 60 periods including 12 months of the year 2019. Plot the errors for in-sample periods and calculate RMSE. Comment on the error plot with respect to the existence of pattern or lack of visible pattern. Month/Year 2015 2016 2017 2018 Jan 800 860 1110 1290 Feb 810 870 1120 1330 Mar 840 900 1160 1360 900 Apr 1230 1050 1470 May 1000 1170 1340 1620 1100 Jun 1300 1450 1780 1160 Jul 1380 1870 1530 Aug 1100 1310 1450 1770 1050 Sep 1250 1390 1720 Oct 1010 1200 1350 1635 Nov 850 1050 1220 1400 Dec 830 1020 1170 1370 Month Year 2015 2016 2018 Jan 800 860 1110 1290 Feb 870 1120 1330 Mar 900 1160 1360 Apr 900 1230 1470 Na 1000 1170 1340 1620 Tun 1100 1300 1450 1780 1160 1380 1530 1870 Aug 1100 1310 1450 1770 Sep 1050 1390 1720 Oct 1350 1635 Nov 1050 1220 1400 Dec 850 1170 1370 Total points 125. Submit through D2L in Word/Excel format, single or multiple files. Must show all Excel work, answer all parts of the question, and write necessary explanations to earn full points. You have to use Excel to solve this numerical problem (project). The following table gives monthly data for four years in million tons of consumption of ice cream in a country. Plot the series and comment on the visible seasonality and trend. Estimate the centered moving averages for this monthly series. Plot CMA and comment. Next, estimate the S.I component which only includes seasonal and irregular movements of the series. Then find the seasonal indexes for the twelve months removing the irregular component. Find the de-seasonalized levels for the series. Plot De- seasonalized Y and comment. Then estimate the trend values for the four sample years and the 12 months of the year 2019 (beyond the sample years) using linear regression Finally, make the forecast for the 12 months of 2015 using the Ratio-to-Moving Average method to capture the Trend and Seasonal patterns, using Excel. Plot the forecasted values for the 60 periods including 12 months of the year 2019. Plot the errors for in-sample periods and calculate RMSE. Comment on the error plot with respect to the existence of pattern or lack of visible patternStep by Step Solution
There are 3 Steps involved in it
Step: 1

Get Instant Access to Expert-Tailored Solutions
See step-by-step solutions with expert insights and AI powered tools for academic success
Step: 2

Step: 3
Ace Your Homework with AI
Get the answers you need in no time with our AI-driven, step-by-step assistance
Get Started
Practical Financial Management
Authors: William R. Lasher
7th edition
128560721X, 9781133593669, 1133593682, 9781285607214, 978-1133593683