

Question
Please show all of your work for these problems and also use the 10 step hypothesis testing procedure MATLAB code for these problems for all
Please show all of your work for these problems and also use the 10 step hypothesis testing procedure MATLAB code for these problems for all applicable situations
- Packed cell volume determinations were made on two groups of children with cyanotic congenital heart disease. The sample sizes and variances were as follows:
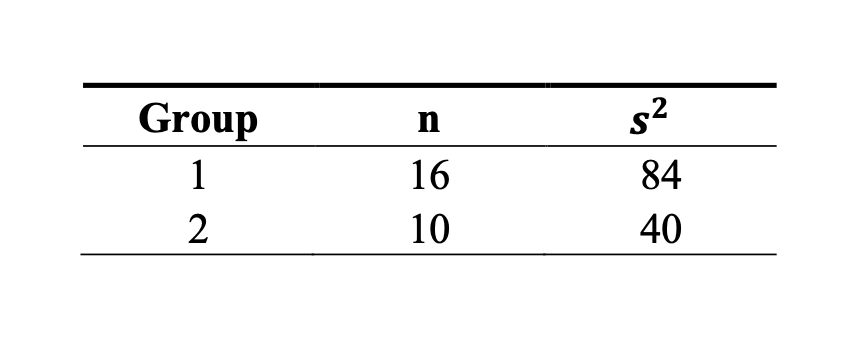
1) Do these data provide sufficient evidence to indicate that the variance of the first population is greater than 60 and the variance of the second population is greater than 30? Let = 0.05.
2) Do these data provide sufficient evidence to indicate that the variance of population 2 is larger than the variance of population 1? Let = 0.05.
2. Protoporphyrin levels were measured in two samples of subjects. Sample1 consisted of 25 adult male alcoholics with ring sideroblasts in the bone marrow. Sample 2 consisted of 20 apparently healthy adult nonalcoholic males. The mean protoporphyrin levels and standard deviations for the two samples were as follows.

Can one conclude on the basis of the data that protoporphyrin levels are higher in the represented alcoholic population than in the nonalcoholic population? Let = 0.01. 1) Test the hypothesis that the population variances are unequal (alternative hypothesis). 2) Test if the protoporphyrin levels are higher in the represented alcoholic population than in the nonalcoholic population (alternative hypothesis) with the assumption that population variances are unknown and not equal.
\begin{tabular}{ccc} \hline Group & n & s2 \\ \hline 1 & 16 & 84 \\ 2 & 10 & 40 \\ \hline \end{tabular} \begin{tabular}{ccc} \hline Sample & x & s \\ \hline 1 & 340 & 250 \\ 2 & 45 & 25 \\ \hline \end{tabular} \begin{tabular}{ccc} \hline Group & n & s2 \\ \hline 1 & 16 & 84 \\ 2 & 10 & 40 \\ \hline \end{tabular} \begin{tabular}{ccc} \hline Sample & x & s \\ \hline 1 & 340 & 250 \\ 2 & 45 & 25 \\ \hline \end{tabular}Step by Step Solution
There are 3 Steps involved in it
Step: 1

Get Instant Access to Expert-Tailored Solutions
See step-by-step solutions with expert insights and AI powered tools for academic success
Step: 2

Step: 3
Ace Your Homework with AI
Get the answers you need in no time with our AI-driven, step-by-step assistance
Get Started
Information Technology And Insights Audit Controls Bringing A Vision And Understanding To Effective Practices
Authors: R. Allen Conner
1st Edition
1720081883, 978-1720081883