Answered step by step
Verified Expert Solution
Question
1 Approved Answer
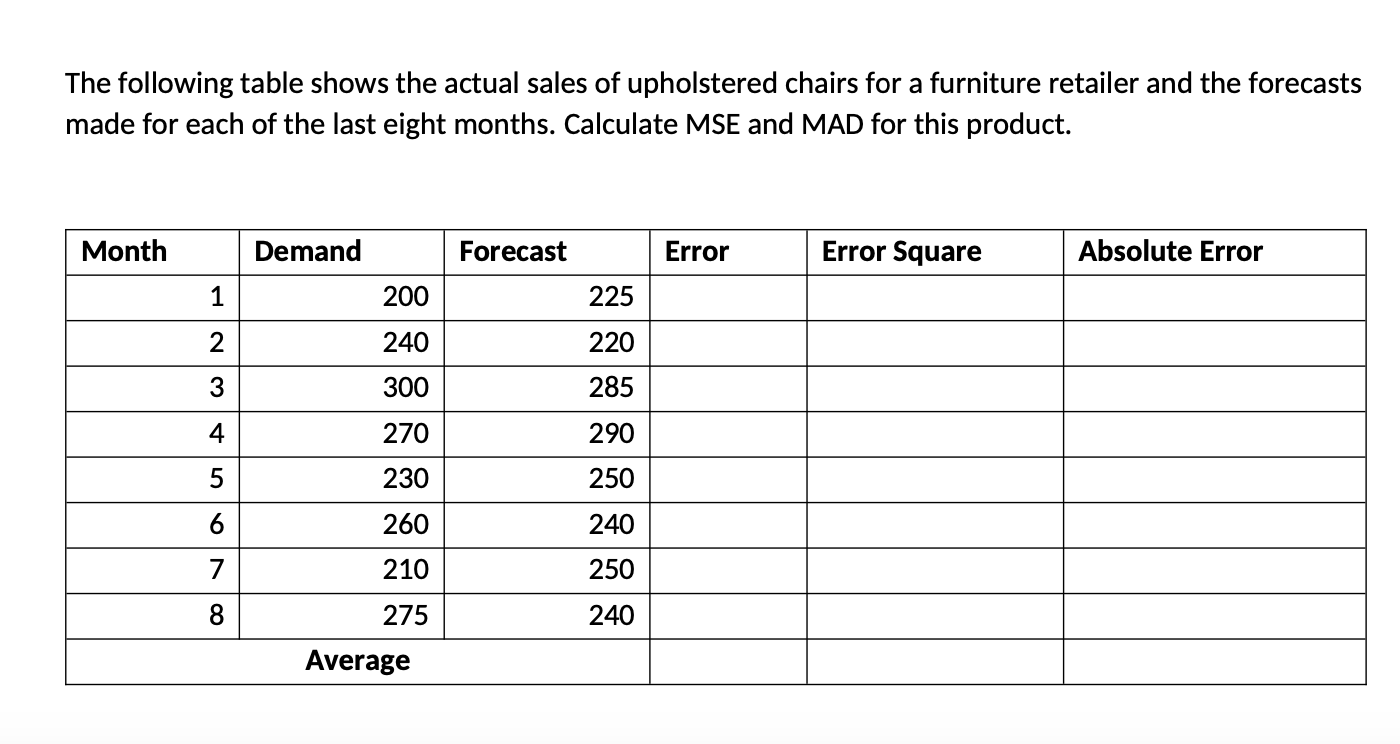
Please show all steps when solving. Thank you! The following table shows the actual sales of upholstered chairs for a furniture retailer and the forecasts
Please show all steps when solving. Thank you!


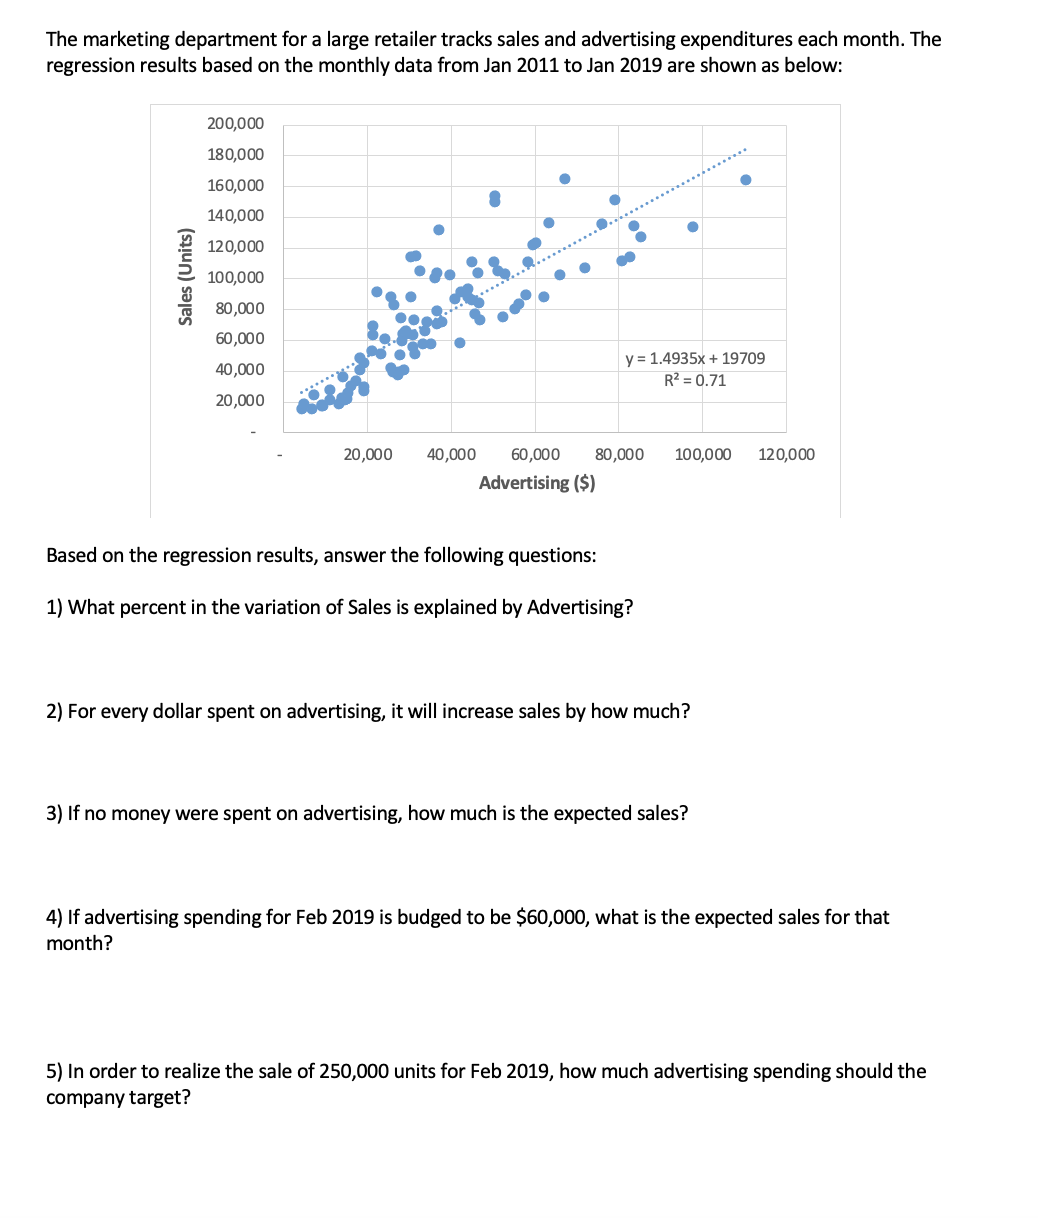
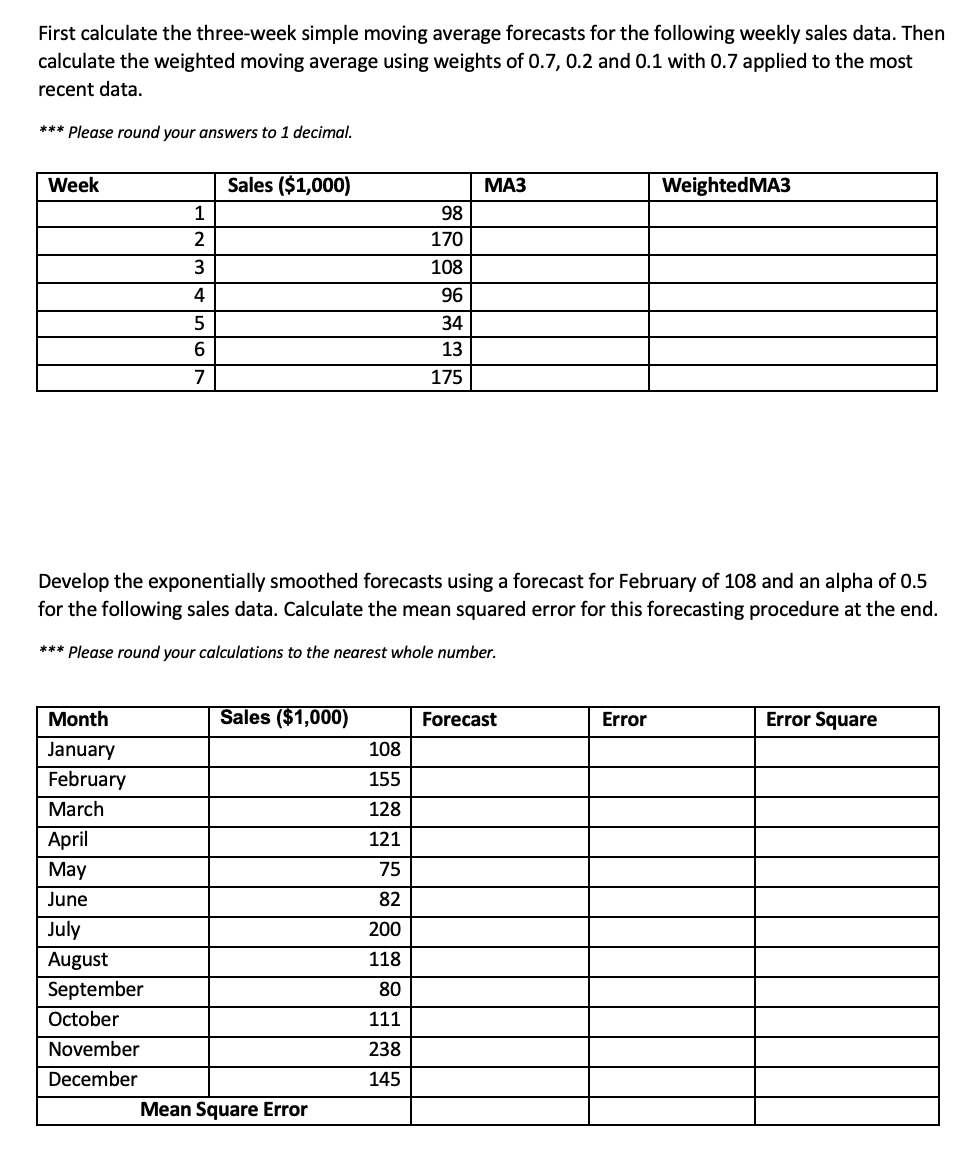
 The following table shows the actual sales of upholstered chairs for a furniture retailer and the forecasts made for each of the last eight months. Calculate MSE and MAD for this product. The marketing department for a large retailer tracks sales and advertising expenditures each month. The regression results based on the monthly data from Jan 2011 to Jan 2019 are shown as below: Based on the regression results, answer the following questions: 1) What percent in the variation of Sales is explained by Advertising? 2) For every dollar spent on advertising, it will increase sales by how much? 3) If no money were spent on advertising, how much is the expected sales? 4) If advertising spending for Feb 2019 is budged to be $60,000, what is the expected sales for that month? 5) In order to realize the sale of 250,000 units for Feb 2019, how much advertising spending should the company target? First calculate the three-week simple moving average forecasts for the following weekly sales data. Then calculate the weighted moving average using weights of 0.7,0.2 and 0.1 with 0.7 applied to the most recent data. Please round your answers to 1 decimal. Develop the exponentially smoothed forecasts using a forecast for February of 108 and an alpha of 0.5 for the following sales data. Calculate the mean squared error for this forecasting procedure at the end. Please round your calculations to the nearest whole number
 Step by Step Solution
There are 3 Steps involved in it
Step: 1

Get Instant Access to Expert-Tailored Solutions
See step-by-step solutions with expert insights and AI powered tools for academic success
Step: 2

Step: 3

Ace Your Homework with AI
Get the answers you need in no time with our AI-driven, step-by-step assistance
Get Started


