Answered step by step
Verified Expert Solution
Question
1 Approved Answer
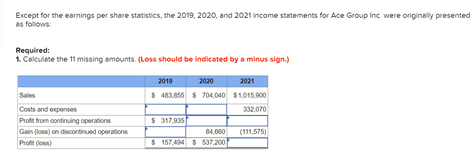
please show all work!! Except for the earnings per share statistics, the 2019, 2020, and 2021 Income statements for Ace Group Inc. were originally presented


please show all work!!
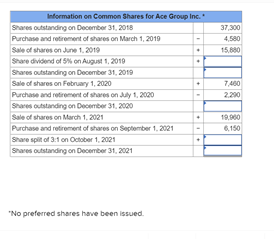
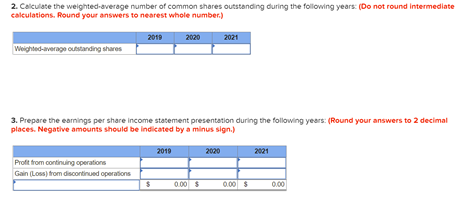
Except for the earnings per share statistics, the 2019, 2020, and 2021 Income statements for Ace Group Inc. were originally presented as follows: Required: 1. Calculate the 11 missing amounts. (Loss should be indicated by a minus sign.) Sales Costs and expenses Profit from continuing operations Gain floss) on discontinued operations Profit 2019 2020 2021 $ 483,055 $ 704,040 $1,015,900 332,070 $ 317,936 84,600 (111,575 $157,494 $ 537,200 37,300 4.580 15.880 Information on Common Shares for Ace Group Inc. Shares outstanding on December 31, 2018 Purchase and retirement of shares on March 1, 2019 Sale of shares on June 1, 2019 Share dividend of 5% on August 1, 2019 Shares outstanding on December 31, 2019 Sale of shares on February 1, 2020 Purchase and retirement of shares on July 1, 2020 Share outstanding on December 31, 2000 Sale of shares on March 1, 2021 Purchase and retirement of shares on September 1, 2021 Share spit of 3.1 on October 1, 2021 Share outstanding on December 31, 2021 7,460 2.200 19.000 6,150 "No preferred shares have been issued. 2. Calculate the weighted-average number of common shares outstanding during the following years: (Do not round Intermediate calculations. Round your answers to nearest whole number.) 2019 2020 2021 Weighted average outstanding shares 3. Prepare the earnings per share income statement presentation during the following years: (Round your answers to 2 decimal places. Negative amounts should be indicated by a minus sign.) 2019 2020 2021 Profit from continuing operations Gain (Loss) from discontinued operations $ 0.00 $ 0.00 $ 0.00 Except for the earnings per share statistics, the 2019, 2020, and 2021 Income statements for Ace Group Inc. were originally presented as follows: Required: 1. Calculate the 11 missing amounts. (Loss should be indicated by a minus sign.) Sales Costs and expenses Profit from continuing operations Gain floss) on discontinued operations Profit 2019 2020 2021 $ 483,055 $ 704,040 $1,015,900 332,070 $ 317,936 84,600 (111,575 $157,494 $ 537,200 37,300 4.580 15.880 Information on Common Shares for Ace Group Inc. Shares outstanding on December 31, 2018 Purchase and retirement of shares on March 1, 2019 Sale of shares on June 1, 2019 Share dividend of 5% on August 1, 2019 Shares outstanding on December 31, 2019 Sale of shares on February 1, 2020 Purchase and retirement of shares on July 1, 2020 Share outstanding on December 31, 2000 Sale of shares on March 1, 2021 Purchase and retirement of shares on September 1, 2021 Share spit of 3.1 on October 1, 2021 Share outstanding on December 31, 2021 7,460 2.200 19.000 6,150 "No preferred shares have been issued. 2. Calculate the weighted-average number of common shares outstanding during the following years: (Do not round Intermediate calculations. Round your answers to nearest whole number.) 2019 2020 2021 Weighted average outstanding shares 3. Prepare the earnings per share income statement presentation during the following years: (Round your answers to 2 decimal places. Negative amounts should be indicated by a minus sign.) 2019 2020 2021 Profit from continuing operations Gain (Loss) from discontinued operations $ 0.00 $ 0.00 $ 0.00
Step by Step Solution
There are 3 Steps involved in it
Step: 1

Get Instant Access to Expert-Tailored Solutions
See step-by-step solutions with expert insights and AI powered tools for academic success
Step: 2

Step: 3

Ace Your Homework with AI
Get the answers you need in no time with our AI-driven, step-by-step assistance
Get Started


