Please show all work / formulas and explanations.


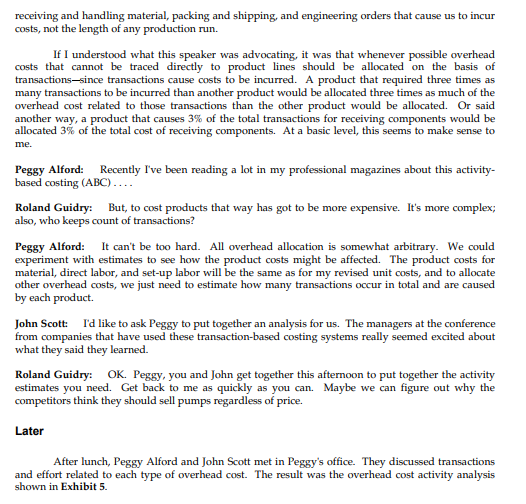
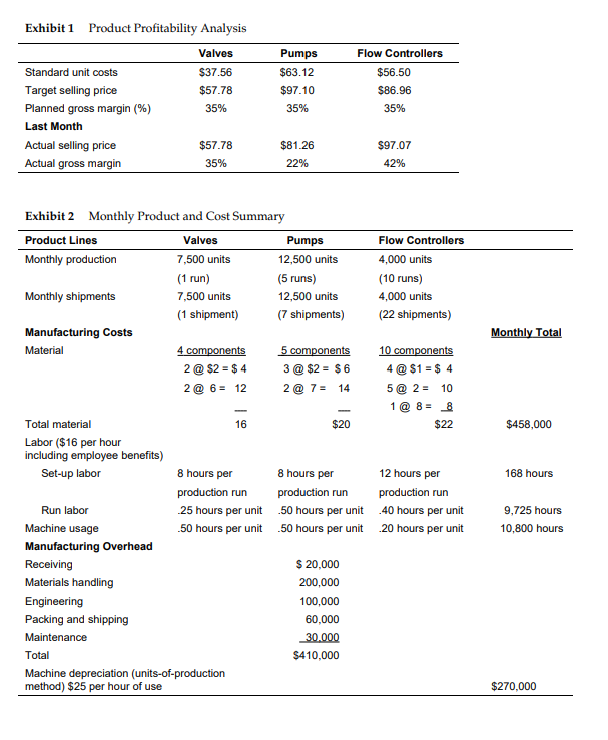
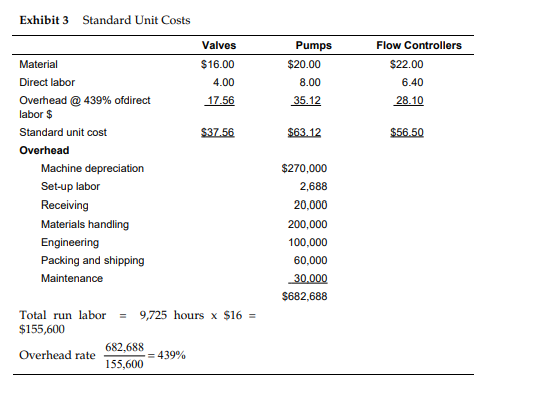
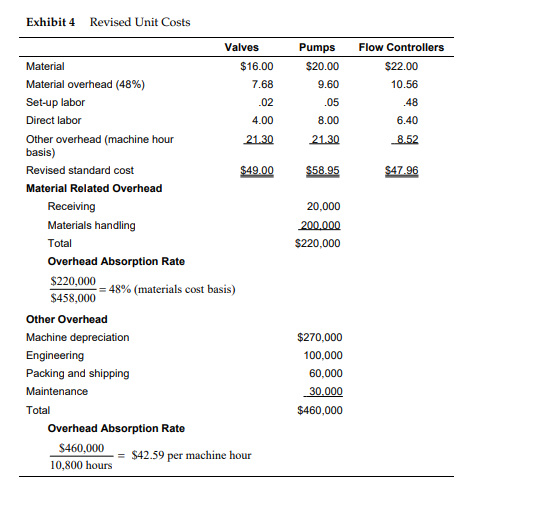
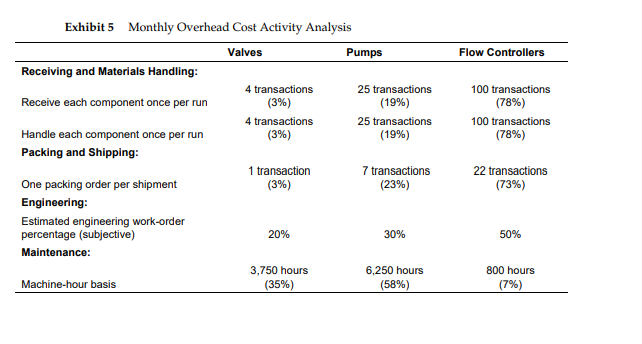
1. Use the Overhead Cost Activity Analysis in Exhibit 5 and other data on manufacturing costs to estimate product costs for valves, pumps, and flow controllers. 2. Compare the estimated costs you calculate to existing standard unit costs (Exhibit 3) and the revised unit costs (Exhibit 4). What causes the different product costing methods to produce such different results? 3. What are the strategic implications of your analysis? What actions would you recommend to the managers at Destin Brass Products Co? 4. Assume that interest in a new basis for cost accounting at Destin Brass Products remains high. In the following month, quantities produced and sold, activities, and costs were all at standard. How much higher or lower would the net income reported under the activity-transaction-based system be than the net income that will be reported under the present, more traditional system? Why? Destin Brass Products Co. Every month it becomes clearer to me that our competitors either know something that we do not know, or they are crazy. I realize that pumps are a major product in a big market for all of us, but with the price cutting that is going on, it is likely that no one will be able to sell pumps profitably if they keep forcing us to match their lower prices. I guess we should be grateful that competitors seem to be overlooking the opportunities for profit in flow controllers. Even with the 12% price increase we made there, our sales representatives report no new competition. Roland Guidry, president of Destin Brass Products, was discussing product profitability in the latest month with Peggy Alford, his controller, and John Scott, his manufacturing manager. The meeting among the three was taking place in an atmosphere tinged with apprehension because competitors had been reducing prices on pumps, Destin Brass Product's major product line. With no unique design advantage, managers at Destin had seen no alternative except to match the reduced prices while trying to maintain volumes. Moreover, the company's profits in the latest month had slipped again to be lower than those in the prior month. The purpose of the meeting was to try to understand the competitive trends and to develop new strategies for dealing with them if new strategies were appropriate. The three managers, along with Steve Abbott, sales and marketing manager, who could not attend because he was away, were very concerned because they held significant shares of ownership in Destin Brass Products. Locally, they were a success story; the company had grown to be a significant business in Destin, Florida, better known for its white sand beaches and as "the Luckiest Fishing Village in the World." The Company Destin Brass Products Co. was established by Abbott, Guidry, and Scott, who purchased a moribund commercial machine shop in 1984. Steve Abbott had sensed an opportunity in a conversation with the president of a large manufacturer of water purification equipment who was dissatisfied with the quality of brass valves available. John Scott was a local legend because of the high-quality brass boat fittings he had always manufactured for the fishing fleet along the Florida Gulf Coast. Roland Guidry had recently retired from the United States Air Force, where he had a long record of administrative successes. The three then selected Peggy Alford, an accountant with manufacturing experience, to join them. John Scott was quick to analyze the nature of problems other manufacturers were having with water purification valves. The tolerances needed were small, and to maintain them required great labor skill or expensive machine controls, or both. Within weeks of forming the company, Scott and his shop crew were manufacturing valves that met or exceeded the needed specifications. Abbott negotiated a contract with the purification equipment manufacturer, and revenues soon were earned. The company had grown quickly because the demand for water purification equipment increased, and Destin Brass Products became the sole supplier of valves to its customer. However, Abbott and Guidry both had greater ambitions. Knowing that the same manufacturing skills used in machining valves could also be used in manufacturing brass pumps and flow controllers, they created an engineering department and designed new products for those markets. Pumps were known to be an even larger market than valves, and flow controllers were often used in the same fluid distribution systems as valves and pumps. Moreover, by specializing in brass, the company could exploit Scott's special knowledge about working with the material. Destin did no foundry work. Instead, components were purchased from brass foundries and then were precisely machined and assembled in the company's new modern manufacturing facility. The same equipment and labor were used for all three product lines, and runs were scheduled to match customer shipping requirements. The foundries had agreed to just-in-time deliveries, and products were packed and shipped as completed. Guidry described the factory to his friends as "a very modern job shop in specialized products made from brass." The Products Valves (24% of company revenues) were created from four brass components. Scott had designed machines that held each component in jigs while it was machined automatically. Each machinist could operate two machines and assemble the valves as machining was taking place. The expense of precise machining made the cost of Destin's valves too high to compete in the nonspecialized valve market, so all monthly production of valves took place in a single production run, which was immediately shipped to its single customer upon completion. Although Scott felt several competitors could match Destin's quality in valves, none had tried to gain market share by cutting price, and gross margins had been maintained at a standard 35%. Pumps (55% of revenues) were created by a manufacturing process that was practically the same as that for valves. Five components required machining and assembly. The pumps were then shipped to each of seven industrial product distributors on a monthly basis. To supply the distributors, whose orders were fairly stable as long as Destin would meet competitive prices, the company scheduled five production runs each month. Pump prices to distributors had been under considerable pressure. The pump market was large, and specifications were less precise than those for valves. Recently, it seemed as if each month brought new reports of reduced prices for pumps. Steve Abbott felt Destin had no choice but to match the lower prices or give up its place as a supplier of pumps. As a result, gross margins on pumps sales in the latest month had fallen to 22%, well below the company's planned gross margin of 35%. Guidry and Alford could not see how the competitors could be making profits at current prices unless pumps were being subsidized by other products. Flow controllers (21% of revenues) were used to control the rate and direction of flow of liquids. As with pumps, the manufacturing operations required for flow controllers were similar to those for valves. More components were needed for each finished unit, and more labor was required. In recent months, Destin had manufactured 4,000 flow controllers in 10 production runs, and the finished flow controllers had been distributed in 22 shipments to distributors and other customers. Steve Abbott was trying to understand the market for flow controllers better because it seemed to him that Destin had almost no competition in the flow controller market. He had recently raised flow controller prices by 12% with no apparent effect on demand. The Meeting After the latest month's results had been summarized and reported, Roland Guidry had called Peggy Alford and John Scott into his office to discuss what changes they could or should make in their course of actions. The meeting had opened with his statement above concerning competition in pumps versus flow controllers. Guidry had a copy of the product profitability analysis (Exhibit 1) on his desk. John Scott (Manufacturing manager): It really is amazing to me as well that our competitors keep reducing prices on pumps. Even though our manufacturing process is better than theirs, I truly do not believe we are less efficient or cost effective. Furthermore, I can't see what their motives can be. There are many manufacturers of pumps. Even if we or even several competitors were to drop out of the market, there would still be so many competitors that no monopoly or oligopoly pricing could be maintained. Maybe the competitors just don't realize what their costs are. Could that be, Peggy? Peggy Alford (Controller): That does not seem likely to me! Cost accounting is a well-developed art, and most competent managers and cost accountants have some understanding of how product costs can be measured. In manufacturing businesses like ours, material and labor costs are pretty easily related to products produced, whether in the product design stage or after the fact. So, if anything, our competitors must be making some different assumptions about overhead costs or allocating them to products in some other way. Or, as you said Roland, maybe they have stupidly forgotten that in the long run, prices have to be high enough to provide product margins that cover corporate costs and produce return to owners. Roland Guidry (President): Peggy, I know you have explained to me several times already the choices we could make in allocating overhead to products. In fact, last month you almost sold me on what you called a "modern costing approach," which I rejected because of the work and cost of the changeover. I also was worried about the discontinuity it might cause in our historical data. But I feel that I might need another lesson to help me understand what is happening to us. Could you try once more to explain what we do? Peggy Alford: I would be happy to try again. We have a very traditional cost accounting system that meets all of our needs for preparing financial reports and tax returns. It is built on measurements of direct and indirect costs and on assumptions about our production and sales activity (Exhibit 2). Each unit of product is charged for material cost and labor cost; material cost is based on the prices we pay for components, and labor cost is based on the standard times for run labor times the labor pay rate of $16 per hour. Overhead cost is assigned to products in a two-stage process. First, the overhead costs are assigned to production in our situation, we have only one producing department so we know all overhead costs are assigned correctly at the first stage. Then, we allocate the total overhead cost assigned to production on the basis of production-run labor cost. Every $1.00 of run labor cost causes $4.39 of overhead to be allocated to the product to which the labor was applied. You can see how this works in our "Standard Unit Costs" sheet, which I brought with me (Exhibit 3). This is a fairly inexpensive way to allocate overhead cost because we have to accumulate direct labor cost to prepare factory payroll, and we just use the same measurement in product costing. Roland Guidry: All this looks familiar to me. But remind me again what the choices we discussed earlier were. Peggy Alford: Well, one choice advocated by some would be to forego the overhead cost allocation altogether. Overhead costs could be charged each month as period expenses. Product profitability would then be measured at the contribution margin level, or price less all variable costs, which in our situation are direct material costs. We would still have to make some adjustments at the end of any period we held inventory to satisfy reporting and tax return requirements, but the effort to do that would be fairly trivial. The bigger danger would be that we would forget that all overhead costs have to be covered somehow, and we might allow our prices to slip. John Scott: Yeah, the salesman's mentality in Steve Abbott would make that kind of direct cost accounting dangerous. He would be looking for marginal customers willing to pay marginal prices based on marginal costs. From the outset, we have succeeded in part because we insisted on trying to maintain a 35% gross margin on costs including allocated overhead. Roland Guidry: John, the competitors are real and so are their prices. If we want to stay in pumps, we probably have to meet them head-on. Peggy, please go on. Peggy Alford: The last time we discussed this, Roland, I showed you these revised standard unit costs (Exhibit 4). These are based on a more modern view of the proper way to allocate costs. I put these together in an attempt to allocate better overhead based on activities. First, I identified material related overhead, the cost of receiving and handling material, and allocated that to each product line based on the cost of material. The justification for this change is that material handling does not have any relationship to the labor cost of machining. Second, I took set-up labor cost out of the total overhead and allocated it to each product line. This is a small amount, but the cost of set ups also had no relationship whatever to the total labor cost of a production run. Finally, I substituted machine hours for labor dollars as a basis for allocating the remaining factory overhead. John [Scott] has really done wonders with our machines, but our expenses for machines are probably more than double the cost of labor. Therefore, it seems to me that machine hours better reflect use of an expensive resource and should be used to allocate overhead costs. The results of this proposal made sense to me and may contain a clue about why competitors are chasing lower prices in the pump market. The revised standard cost for pumps is more than $4.00 below our present standard and would show a gross margin percentage of 27% compared to our current 22%. Maybe our competitors just have more modern cost accounting! Roland Guidry: And you said this modern approach would not cost much more to maintain once we adopted it? Peggy Alford: No, it wouldn't. All I really did was to divide the overhead costs into two pools, each of which is allocated on a different measure of activity. Roland Guidry: And, we could use the same numbers for financial reports and tax returns? Peggy Alford: Absolutely. (John Scott had been examining the revised unit costs and suddenly spoke up.) John Scott: Peggy! This new method makes valves look more costly and flow controllers even more profitable than we know they are. Peggy Alford: ... or, thought they were! The profit for each product line will change if we change the way we allocate overhead costs to products. John Scott: I realize that. But it seems to me that product costs should have more to do with the costs caused by producing and selling the product. That's usually true for material and maybe direct labor, but it is not true for most of these overhead costs. For example, we probably spend one-half of our engineering effort on flow controllers, but whether you use direct labor dollars or machine hours to allocate engineering costs to products, flow controllers don't get much of the engineering costs. I've been thinking about this a lot since last week when I attended an "Excellence in Manufacturing" conference in Tallahassee. One presentation was about "Cost Accounting for the New Manufacturing Environment." I couldn't follow all of the arguments of the speaker, but the key seemed to be that activity, rather than production volume, causes costs. In our operations, it is receiving and handling material, packing and shipping, and engineering orders that cause us to incur costs, not the length of any production run. If I understood what this speaker was advocating, it was that whenever possible overhead costs that cannot be traced directly to product lines should be allocated on the basis of transactions-since transactions cause costs to be incurred. A product that required three times as many transactions to be incurred than another product would be allocated three times as much of the overhead cost related to those transactions than the other product would be allocated. Or said another way, a product that causes 3% of the total transactions for receiving components would be allocated 3% of the total cost of receiving components. At a basic level, this seems to make sense to me. Peggy Alford: Recently I've been reading a lot in my professional magazines about this activity- based costing (ABC) .... Roland Guidry: But, to cost products that way has got to be more expensive. It's more complex; also, who keeps count of transactions? Peggy Alford: It can't be too hard. All overhead allocation is somewhat arbitrary. We could experiment with estimates to see how the product costs might be affected. The product costs for material, direct labor, and set-up labor will be the same as for my revised unit costs, and to allocate other overhead costs, we just need to estimate how many transactions occur in total and are caused by each product. John Scott: I'd like to ask Peggy to put together an analysis for us. The managers at the conference from companies that have used these transaction-based costing systems really seemed excited about what they said they learned. Roland Guidry: OK. Peggy, you and John get together this afternoon to put together the activity estimates you need. Get back to me as quickly as you can. Maybe we can figure out why the competitors think they should sell pumps regardless of price. Later After lunch, Peggy Alford and John Scott met in Peggy's office. They discussed transactions and effort related to each type of overhead cost. The result was the overhead cost activity analysis shown in Exhibit 5. Exhibit 1 Product Profitability Analysis Valves $37.56 $57.78 35% Standard unit costs Target selling price Planned gross margin (%) Last Month Actual selling price Actual gross margin Monthly shipments Manufacturing Costs Material Exhibit 2 Monthly Product and Cost Summary Product Lines Valves Monthly production 7,500 units (1 run) 7,500 units (1 shipment) Total material Labor ($16 per hour including employee benefits) Set-up labor Run labor Machine usage $57.78 35% Manufacturing Overhead Receiving Materials handling Engineering Packing and shipping Maintenance 4 components 2 @ $2= $4 2 @ 6 = 12 - Total Machine depreciation (units-of-production method) $25 per hour of use 16 8 hours per production run 25 hours per unit 50 hours per unit Pumps $63.12 $97.10 35% $81.26 22% Pumps 12,500 units (5 runs) 12,500 units (7 shipments) 5 components 3 @ $2= $6 2 @ 7= 14 $20 Flow Controllers 8 hours per production run 50 hours per unit 50 hours per unit $ 20,000 200,000 100,000 60,000 30.000 $410,000 $56.50 $86.96 35% $97.07 42% Flow Controllers 4,000 units (10 runs) 4,000 units (22 shipments) 10 components 4 @ $1 = $ 4 5 2= 10 1 @ 8= 8 $22 12 hours per production run 40 hours per unit 20 hours per unit Monthly Total $458,000 168 hours 9,725 hours 10,800 hours $270,000 Exhibit 3 Standard Unit Costs Material Direct labor Overhead @ 439% of direct labor $ Standard unit cost Overhead Machine depreciation Set-up labor Receiving Materials handling Engineering Packing and shipping Maintenance 682,688 155,600 Valves $16.00 4.00 17.56 Total run labor = 9,725 hours x $16 = $155,600 Overhead rate =439% $37.56 Pumps $20.00 8.00 35.12 $63.12 $270,000 2,688 20,000 200,000 100,000 60,000 30,000 $682,688 Flow Controllers $22.00 6.40 28.10 $56.50 Exhibit 4 Revised Unit Costs Material Material overhead (48%) Set-up labor Direct labor Other overhead (machine hour basis) Revised standard cost Material Related Overhead Receiving Materials handling Total Overhead Absorption Rate $220,000 $458,000 Other Overhead Machine depreciation Engineering Packing and shipping Maintenance Total Valves = 48% (materials cost basis) Overhead Absorption Rate $460,000 10,800 hours $16.00 7.68 .02 4.00 21.30 $49.00 = $42.59 per machine hour Pumps $20.00 9.60 .05 8.00 21.30 $58.95 20,000 200.000 $220,000 $270,000 100,000 60,000 30,000 $460,000 Flow Controllers $22.00 10.56 .48 6.40 8.52 $47.96 Exhibit 5 Monthly Overhead Cost Activity Analysis Valves Receiving and Materials Handling: Receive each component once per run Handle each component once per run Packing and Shipping: One packing order per shipment Engineering: Estimated engineering work-order percentage (subjective) Maintenance: Machine-hour basis 4 transactions (3%) 4 transactions (3%) 1 transaction (3%) 20% 3,750 hours (35%) Pumps 25 transactions (19%) 25 transactions (19%) 7 transactions (23%) 30% 6,250 hours (58%) Flow Controllers 100 transactions (78%) 100 transactions (78%) 22 transactions (73%) 50% 800 hours (7%)


