

Answered step by step
Verified Expert Solution
Question
1 Approved Answer
please show all work in Excel CHAPTER 3: FINANCIAL STATEMENT ANALYSIS TOOLS NOTE: PLEASE USE WORKSHEET #3 IN THE ATTACHED EXCEL FILE TITLED Homework for
please show all work in Excel
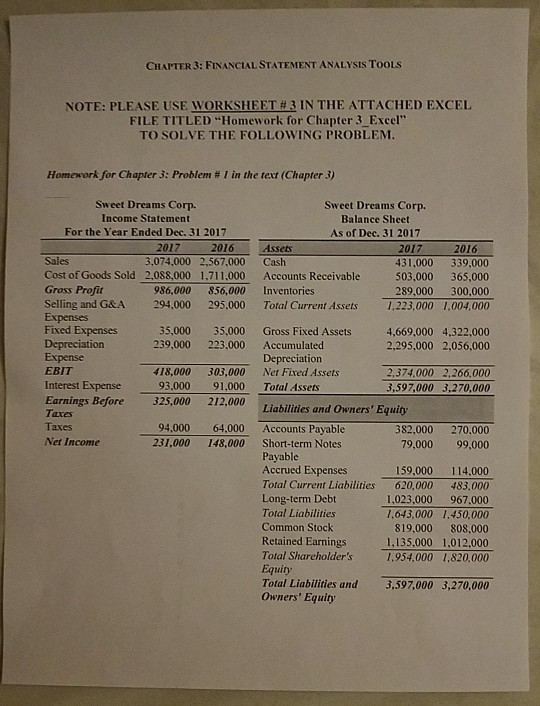
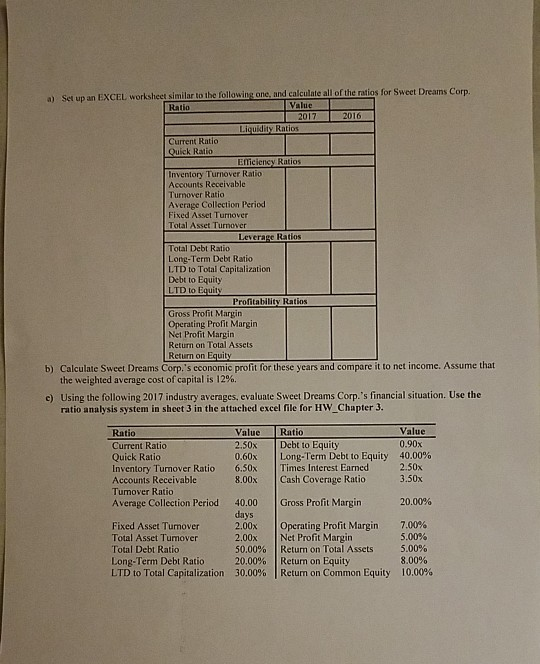
CHAPTER 3: FINANCIAL STATEMENT ANALYSIS TOOLS NOTE: PLEASE USE WORKSHEET #3 IN THE ATTACHED EXCEL FILE TITLED "Homework for Chapter 3_Excel TO SOLVE THE FOLLOWING PROBLEM. Homework for Chapter 3: Problem #1 in the text (Chapter 3) Sweet Dreams Corp. Balance Sheet As of Dec. 31 2017 Assets 2017 2016 Cash 431.000 339,000 Accounts Receivable 503.000 365,000 Inventories 289,000 300,000 Total Current Assets 1.223.000 1.004.000 Sweet Dreams Corp. Income Statement For the Year Ended Dec. 31 2017 2017 2016 Sales 3,074,000 2.567,000 Cost of Goods Sold 2,088.000 1,711,000 Gross Profit 9 86,000 856,000 Selling and G&A 294.000 295.000 Expenses Fixed Expenses 35,000 35.000 Depreciation 239,000 223.000 Expense EBIT 418,000 303,000 Interest Expense 93.000 91,000 Earnings Before 325,000 212,000 Taxes Taxes 94.000 64,000 Net Income 231,000 148,000 Gross Fixed Assets 4,669,000 4,322,000 Accumulated 2,295,000 2,056,000 Depreciation Net Fixed Assets 2,374,000 2,266,000 Total Assets 3.597,000 3,270,000 Liabilities and Owners' Equity Accounts Payable 382,000 270,000 Short-term Notes 79,000 99.000 Payable Accrued Expenses 159.000 114.000 Total Current Liabilities 620,000 483,000 Long-term Debt 1,023,000 967.000 Total Liabilities 1.643,000 7,450,000 Common Stock 819.000 808,000 Retained Earnings 1,135.000 1.012,000 Total Shareholder's 1.954.000 1.820,000 Equiry Total Liabilities and 3,597,000 3,270,000 Owners' Equity a Stan EXCEL workshost similar to the following one, and calculate all of the ratios for Sweet Dreams Corn Ratio Vales 2017 2016 Liquidity Ratios Current Ratio Quick Ratio Emisiers Ratios Inventory Turnover Ratio Accounts Receivable Turnover Ratio Average Collection Period Fixed Asset Turnover Total Asset Turnover Leverage Ratios Total Debt Ratio Long-Term Debt Ratio LTD to Total Capitalization Debt to Equity LTD to Equity Profitability Ratios Gross Profit Margin Operating Profit Margin Net Profit Margin Return on Total Assets Return on Equity b) Calculate Sweet Dreams Corp.'s economic profit for these years and compare it to net income. Assume that the weighted average cost of capital is 12% e) Using the following 2017 industry averages, evaluate Sweet Dreams Corp.'s financial situation. Use the ratio analysis system in sheet 3 in the attached excel file for HW Chapter 3. Ratio Current Ratio Quick Ratio Inventory Turnover Ratio Accounts Receivable Tumover Ratio Average Collection Period Value 2.50x 0.60x 6.50x 8.00x Ratio Debt to Equity Long-Term Debt to Equity Times Interest Earned Cash Coverage Ratio Value 0.90x 40.00% 2.50x 3.50x Gross Profit Margin 20.00% 40.00 days 2.00x 2.00x 50.00% 20.00% 30.00% Fixed Asset Turnover Total Asset Tumover Total Debt Ratio Long-Term Debt Ratio LTD to Total Capitalization 7.00% 5.00% Operating Profit Margin Net Profit Margin Return on Total Assets Return on Equity Return on Common Equity 8.00% 10.00%Step by Step Solution
There are 3 Steps involved in it
Step: 1

Get Instant Access to Expert-Tailored Solutions
See step-by-step solutions with expert insights and AI powered tools for academic success
Step: 2

Step: 3
Ace Your Homework with AI
Get the answers you need in no time with our AI-driven, step-by-step assistance
Get Started
Audits Of Public Companies Continued Concentration In Audit Market For Large Public Companies Does Not Call For Immediate Action
Authors: United States Government Accountability
1st Edition
1297008111, 978-1297008115