Answered step by step
Verified Expert Solution
Question
1 Approved Answer
please show all work The average of two identical uniform distributions Generate two sets of 1000 uniform random numbers between 0 and 1 in two
please show all work 


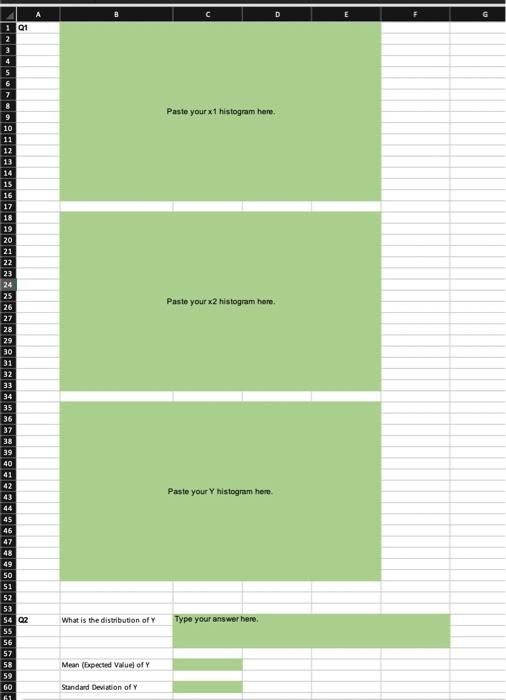
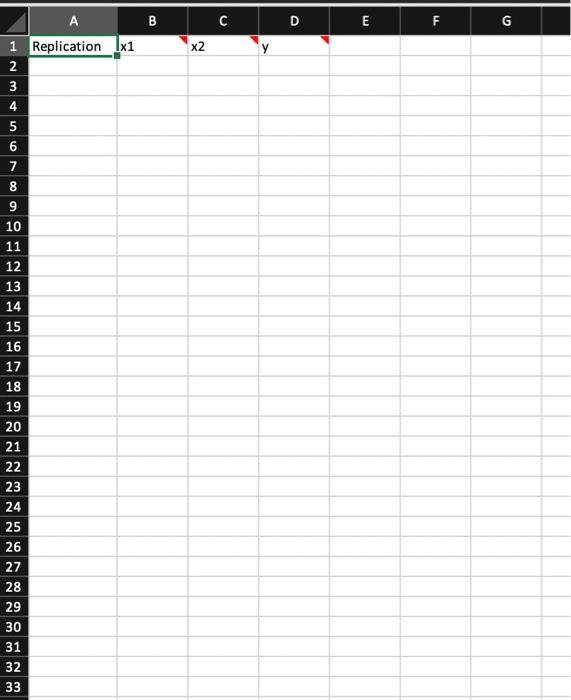
The average of two identical uniform distributions Generate two sets of 1000 uniform random numbers between 0 and 1 in two columns of the Excel sheet for problem 2 (1 denote the random variables as x1 and x2). Add a third column in which you calculate the average of x1 and 2 (y = (x1+x2y2). 1. Construct the histograms for x1, x2, and y with the bins 0.1,0.2, ..., 0.9. Paste the histograms in the answer sheet. (6 pts) 2. What is the distribution of y? What is the mean and standard deviation of y? (4 pts) Modules 1 and 2.xlsx D G 01 Paste your x1 histogram here. Paste your x2 histogram hore. 10 11 12 13 14 15 16 17 18 19 20 21 22 23 24 25 26 27 28 29 30 31 32 33 34 35 36 37 38 39 40 41 42 43 44 45 46 47 48 49 50 51 52 53 54 02 SS 56 57 58 59 60 61 Paste your Y histogram here What is the distribution of Y Type your answer here. Mean (Expected Value of Y Standard Deviation of Y B C D E F G 1x1 x2 3 A 1 Replication 2 3 4 5 6 7 8 9 10 5 7 11 12 13 14 15 16 17 18 19 20 21 22 23 24 25 26 27 28 29 30 31 32 33 The average of two identical uniform distributions Generate two sets of 1000 uniform random numbers between 0 and 1 in two columns of the Excel sheet for problem 2 (1 denote the random variables as x1 and x2). Add a third column in which you calculate the average of x1 and 2 (y = (x1+x2y2). 1. Construct the histograms for x1, x2, and y with the bins 0.1,0.2, ..., 0.9. Paste the histograms in the answer sheet. (6 pts) 2. What is the distribution of y? What is the mean and standard deviation of y? (4 pts) Modules 1 and 2.xlsx D G 01 Paste your x1 histogram here. Paste your x2 histogram hore. 10 11 12 13 14 15 16 17 18 19 20 21 22 23 24 25 26 27 28 29 30 31 32 33 34 35 36 37 38 39 40 41 42 43 44 45 46 47 48 49 50 51 52 53 54 02 SS 56 57 58 59 60 61 Paste your Y histogram here What is the distribution of Y Type your answer here. Mean (Expected Value of Y Standard Deviation of Y B C D E F G 1x1 x2 3 A 1 Replication 2 3 4 5 6 7 8 9 10 5 7 11 12 13 14 15 16 17 18 19 20 21 22 23 24 25 26 27 28 29 30 31 32 33 


Step by Step Solution
There are 3 Steps involved in it
Step: 1

Get Instant Access to Expert-Tailored Solutions
See step-by-step solutions with expert insights and AI powered tools for academic success
Step: 2

Step: 3

Ace Your Homework with AI
Get the answers you need in no time with our AI-driven, step-by-step assistance
Get Started


