Answered step by step
Verified Expert Solution
Link Copied!

Question

1 Approved Answer

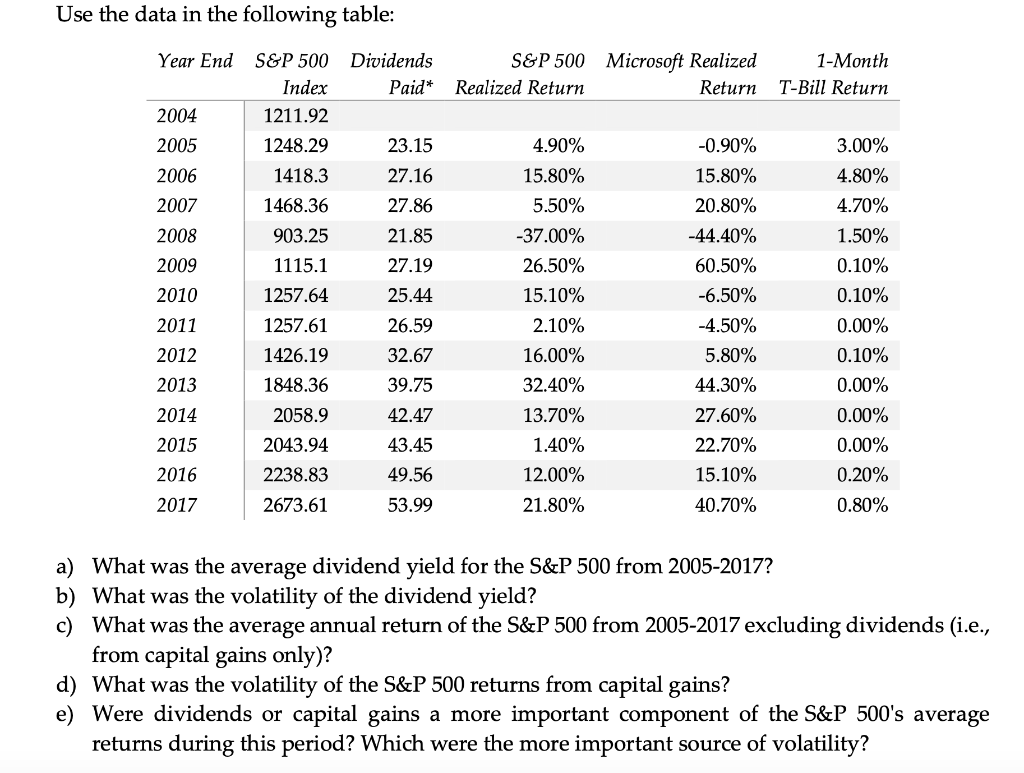
Please show all work Use the data in the following table: Year End Dividends Paid* S&P 500 Microsoft Realized Realized Return Return 1-Month T-Bill Return

image text in transcribedPlease show all workimage text in transcribed

Use the data in the following table: Year End Dividends Paid* S&P 500 Microsoft Realized Realized Return Return 1-Month T-Bill Return 2004 2005 2006 2007 2008 2009 2010 2011 2012 2013 2014 2015 2016 2017 S&P 500 Index 1211.92 1248.29 1418.3 1468.36 903.25 1115.1 1257.64 1257.61 1426.19 1848.36 2058.9 2043.94 2238.83 2673.61 23.15 27.16 27.86 21.85 27.19 25.44 26.59 32.67 39.75 42.47 43.45 49.56 53.99 4.90% 15.80% 5.50% -37.00% 26.50% 15.10% 2.10% 16.00% 32.40% 13.70% 1.40% 12.00% 21.80% -0.90% 15.80% 20.80% -44.40% 60.50% -6.50% -4.50% 5.80% 44.30% 27.60% 22.70% 15.10% 40.70% 3.00% 4.80% 4.70% 1.50% 0.10% 0.10% 0.00% 0.10% 0.00% 0.00% 0.00% 0.20% 0.80% a) What was the average dividend yield for the S&P 500 from 2005-2017? b) What was the volatility of the dividend yield? c) What was the average annual return of the S&P 500 from 2005-2017 excluding dividends (i.e., from capital gains only)? d) What was the volatility of the S&P 500 returns from capital gains? e) Were dividends or capital gains a more important component of the S&P 500's average returns during this period? Which were the more important source of volatility? Year End Dividends Paid* S&P 500 Realized Return Microsoft Realized Return 1-Month T-Bill Return 2004 2005 2006 2007 2008 2009 2010 2011 2012 2013 2014 2015 2016 2017 S&P 500 Index 1211.92 1248.29 1418.3 1468.36 903.25 1115.1 1257.64 1257.61 1426.19 1848.36 2058.9 2043.94 2238.83 2673.61 23.15 27.16 27.86 21.85 27.19 25.44 26.59 32.67 39.75 42.47 43.45 49.56 53.99 4.90% 15.80% 5.50% -37.00% 26.50% 15.10% 2.10% 16.00% 32.40% 13.70% 1.40% 12.00% 21.80% -0.90% 15.80% 20.80% -44.40% 60.50% -6.50% -4.50% 5.80% 44.30% 27.60% 22.70% 15.10% 40.70% 3.00% 4.80% 4.70% 1.50% 0.10% 0.10% 0.00% 0.10% 0.00% 0.00% 0.00% 0.20% 0.80%

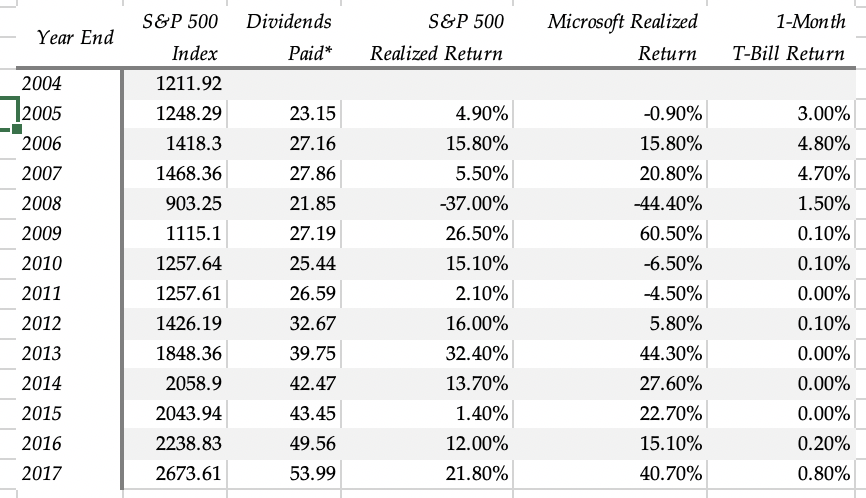
Step by Step Solution

There are 3 Steps involved in it

Step: 1

blur-text-image

Get Instant Access to Expert-Tailored Solutions

See step-by-step solutions with expert insights and AI powered tools for academic success

Step: 2

blur-text-image

Step: 3

blur-text-image

Ace Your Homework with AI

Get the answers you need in no time with our AI-driven, step-by-step assistance

Get Started

Recommended Textbook for

Financial Markets Of Eastern Europe And The Former Soviet Union

Authors: François Perquel

1st Edition

1855733404,1782420002

More Books

Students also viewed these Finance questions