Answered step by step
Verified Expert Solution
Question
1 Approved Answer
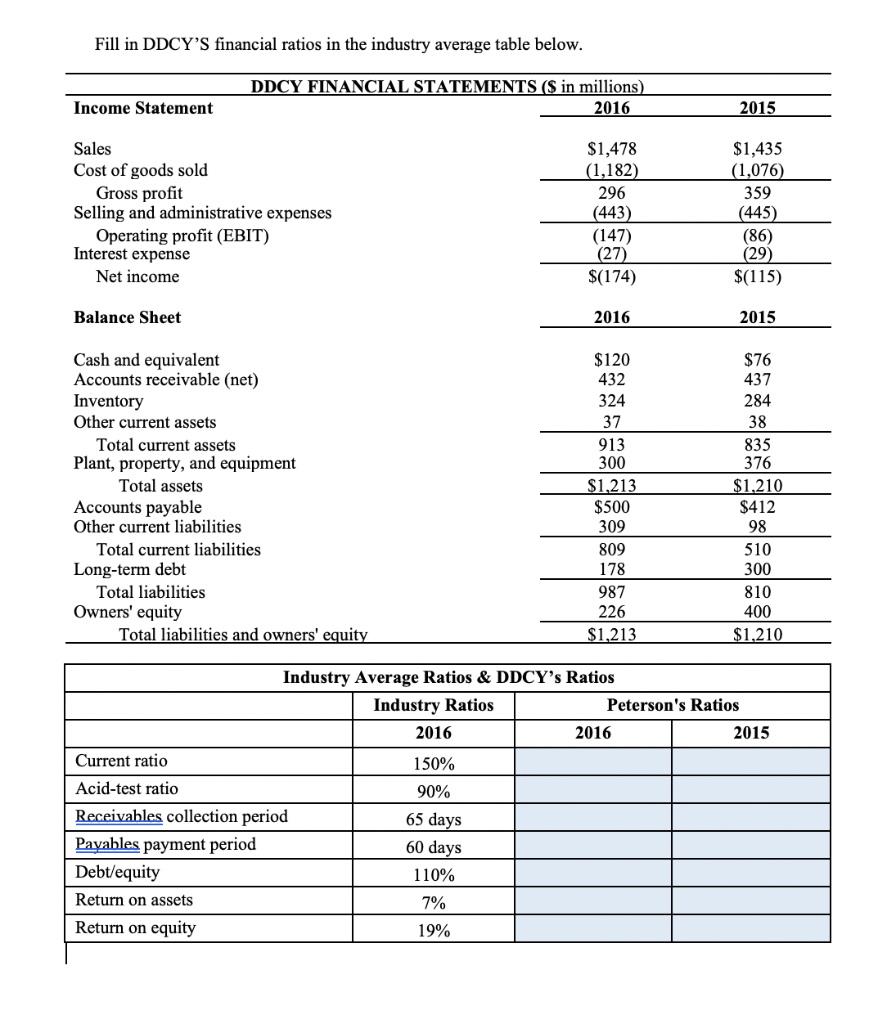
Please show all work/excel formulas used. Fill in DDCY'S financial ratios in the industry average table below. Income Statement Sales Cost of goods sold Gross
Please show all work/excel formulas used.
Fill in DDCY'S financial ratios in the industry average table below. Income Statement Sales Cost of goods sold Gross profit Selling and administrative expenses Operating profit (EBIT) Interest expense Net income Balance Sheet Cash and equivalent Accounts receivable (net) Inventory Other current assets Total current assets Plant, property, and equipment Total assets Accounts payable Other current liabilities Long-term debt Owners' equity DDCY FINANCIAL STATEMENTS ($ in millions) 2016 $1,478 (1,182) 296 (443) (147) (27) $(174) 2016 $120 432 324 37 913 300 $1,213 $500 309 809 178 987 226 $1,213 Industry Average Ratios & DDCY's Ratios Industry Ratios 2016 2016 150% 90% 65 days 60 days 110% 7% 19% Total current liabilities Total liabilities Total liabilities and owners' equity Current ratio Acid-test ratio Receivables collection period Payables payment period Debt/equity Return on assets Return on equity 2015 $1,435 (1,076) 359 (445) (86) (29) $(115) 2015 $76 437 284 38 835 376 $1,210 $412 98 510 300 810 400 $1,210 Peterson's Ratios 2015Step by Step Solution
There are 3 Steps involved in it
Step: 1
Get Instant Access to Expert-Tailored Solutions
See step-by-step solutions with expert insights and AI powered tools for academic success
Step: 2
Step: 3
Ace Your Homework with AI
Get the answers you need in no time with our AI-driven, step-by-step assistance
Get Started