

Question
PLEASE SHOW CODE IN R! A software company catalog firm sells games and educational software. It started out as a software manufacturer and then added
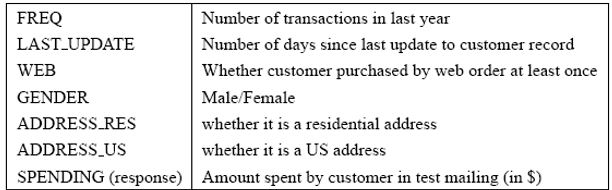
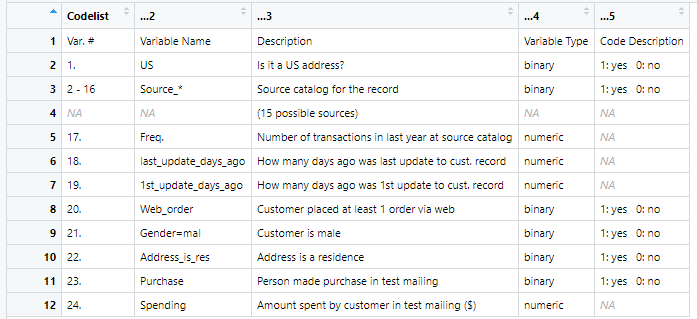
PLEASE SHOW CODE IN R! A software company catalog firm sells games and educational software. It started out as a software manufacturer and then added third-party titles to its offerings. It has recently revised its collection of items in a new catalog, which it mailed out to its customers. This mailing yielded 1000 purchases. Based on these data, the company wants to devise a model for predicting the spending amount that a purchasing customer will yield. The data set is given in the Softwarecompany.xls file which contains the following info (note that the file contains additional variables that you can disregard)
a. Explore the spending amount by creating a pivot table for the categorical variables and computing the average and standard deviation of spending in each category. (you can also do it in R using the function aggregate or tapply in R)
b. Explore the relationship between SPENDING and each of the two continuous predictors by creating scatterplots. Does there seem to be a linear relationship?
c. To fit a predictive model:
Partition the 1000 records into training and validation sets. (use the default partition in XLminer with seed 12345 or if you use R do set.seed(12345))
Run a multiple linear regression model for SPENDING on all six predictors. Give the estimated regression equation.
Based on this model, what type of purchaser is most likely to spend a large amount of money?
If we use backward elimination to reduce the number of predictors, which predictor will be dropped first from the model.
Show how the prediction and the prediction error are computed for the first purchase in the validation set.
Evaluate the predictive accuracy of the model by examining its performance on the validation set. Also compute MAPE which is not given by the computer output.
Create a histogram of the residuals. Do they appear to follow a normal distribution? How does this affect the predictive performance of the model.
Step by Step Solution
There are 3 Steps involved in it
Step: 1

Get Instant Access to Expert-Tailored Solutions
See step-by-step solutions with expert insights and AI powered tools for academic success
Step: 2

Step: 3
Ace Your Homework with AI
Get the answers you need in no time with our AI-driven, step-by-step assistance
Get Started
Rules In Database Systems Third International Workshop Rids 97 Sk Vde Sweden June 26 28 1997 Proceedings Lncs 1312
Authors: Andreas Geppert ,Mikael Berndtsson
1997th Edition
3540635165, 978-3540635161