

Answered step by step
Verified Expert Solution
Question
1 Approved Answer
please show example how to compute. thank you Please use the data provided in the excel file and answer the following questions: Compute the following
please show example how to compute. thank you 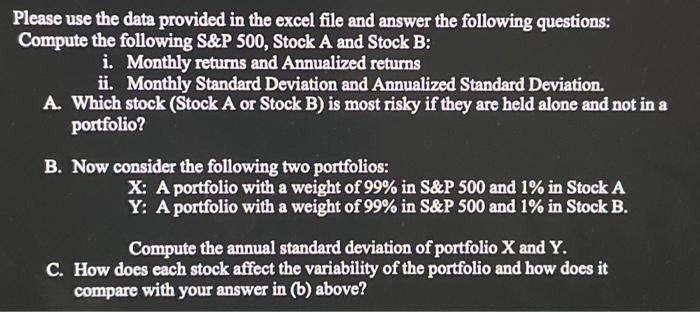
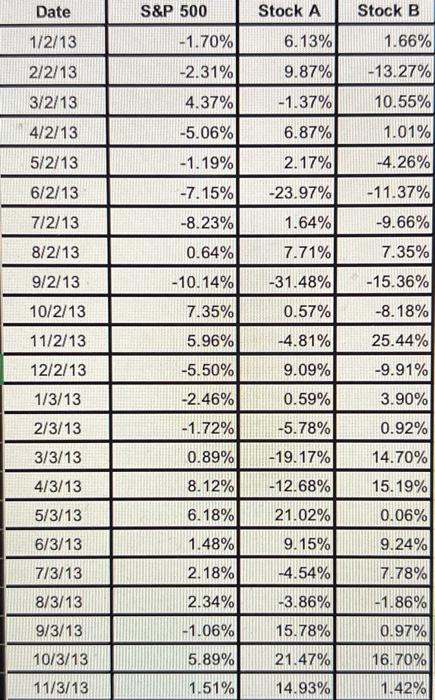
Please use the data provided in the excel file and answer the following questions: Compute the following S&P 500, Stock A and Stock B: i. Monthly returns and Annualized returns ii. Monthly Standard Deviation and Annualized Standard Deviation. A. Which stock (Stock A or Stock B) is most risky if they are held alone and not in a portfolio? B. Now consider the following two portfolios: X: A portfolio with a weight of 99% in S&P 500 and 1% in Stock A Y: A portfolio with a weight of 99% in S&P 500 and 1% in Stock B. Compute the annual standard deviation of portfolio X and Y. C. How does each stock affect the variability of the portfolio and how does it compare with your answer in (b) above? Date S&P 500 Stock A Stock B 1/2/13 -1.70% 6.13% 1.66% 2/2/13 -2.31% 9.87% -13.27% 3/2/13 4.37% -1.37% 10.55% 4/2/13 -5.06% 6.87% 1.01% 5/2/13 -1.19% 2.17% -4.26% 6/2/13 -7.15% -23.97% - 11.37% 7/2/13 -8.23% 1.64% -9.66% 8/2/13 0.64% 7.71% 7.35% 9/2/13 -10.14% -15.36% -31.48% 0.57% 10/2/13 7.35% -8.18% 11/2/13 5.96% -4.81% 25.44% 9.09% 12/2/13 1/3/13 -5.50% -2.46% -9.91% 3.90% 0.59% 2/3/13 -1.72% 0.92% 3/3/13 0.89% -5.78% -19.17% -12.68% 14.70% 4/3/13 8.12% 15.19% 5/3/13 6.18% 21.02% 0.06% 6/3/13 1.48% 9.24% 9.15% -4.54% 7/3/13 2.18% 7.78% -1.86% 8/3/13 2.34% -3.86% 9/3/13 -1.06% 15.78% 0.97% 10/3/13 21.47% 16.70% 5.89% 1.51% 11/3/13 14.93% 1.42% Please use the data provided in the excel file and answer the following questions: Compute the following S&P 500, Stock A and Stock B: i. Monthly returns and Annualized returns ii. Monthly Standard Deviation and Annualized Standard Deviation. A. Which stock (Stock A or Stock B) is most risky if they are held alone and not in a portfolio? B. Now consider the following two portfolios: X: A portfolio with a weight of 99% in S&P 500 and 1% in Stock A Y: A portfolio with a weight of 99% in S&P 500 and 1% in Stock B. Compute the annual standard deviation of portfolio X and Y. C. How does each stock affect the variability of the portfolio and how does it compare with your answer in (b) above? Date S&P 500 Stock A Stock B 1/2/13 -1.70% 6.13% 1.66% 2/2/13 -2.31% 9.87% -13.27% 3/2/13 4.37% -1.37% 10.55% 4/2/13 -5.06% 6.87% 1.01% 5/2/13 -1.19% 2.17% -4.26% 6/2/13 -7.15% -23.97% - 11.37% 7/2/13 -8.23% 1.64% -9.66% 8/2/13 0.64% 7.71% 7.35% 9/2/13 -10.14% -15.36% -31.48% 0.57% 10/2/13 7.35% -8.18% 11/2/13 5.96% -4.81% 25.44% 9.09% 12/2/13 1/3/13 -5.50% -2.46% -9.91% 3.90% 0.59% 2/3/13 -1.72% 0.92% 3/3/13 0.89% -5.78% -19.17% -12.68% 14.70% 4/3/13 8.12% 15.19% 5/3/13 6.18% 21.02% 0.06% 6/3/13 1.48% 9.24% 9.15% -4.54% 7/3/13 2.18% 7.78% -1.86% 8/3/13 2.34% -3.86% 9/3/13 -1.06% 15.78% 0.97% 10/3/13 21.47% 16.70% 5.89% 1.51% 11/3/13 14.93% 1.42% Step by Step Solution
There are 3 Steps involved in it
Step: 1

Get Instant Access to Expert-Tailored Solutions
See step-by-step solutions with expert insights and AI powered tools for academic success
Step: 2

Step: 3
Ace Your Homework with AI
Get the answers you need in no time with our AI-driven, step-by-step assistance
Get Started
Understanding Housing Finance
Authors: Peter King
2nd Edition
0415432952, 978-0415432955