

Answered step by step
Verified Expert Solution
Question
1 Approved Answer
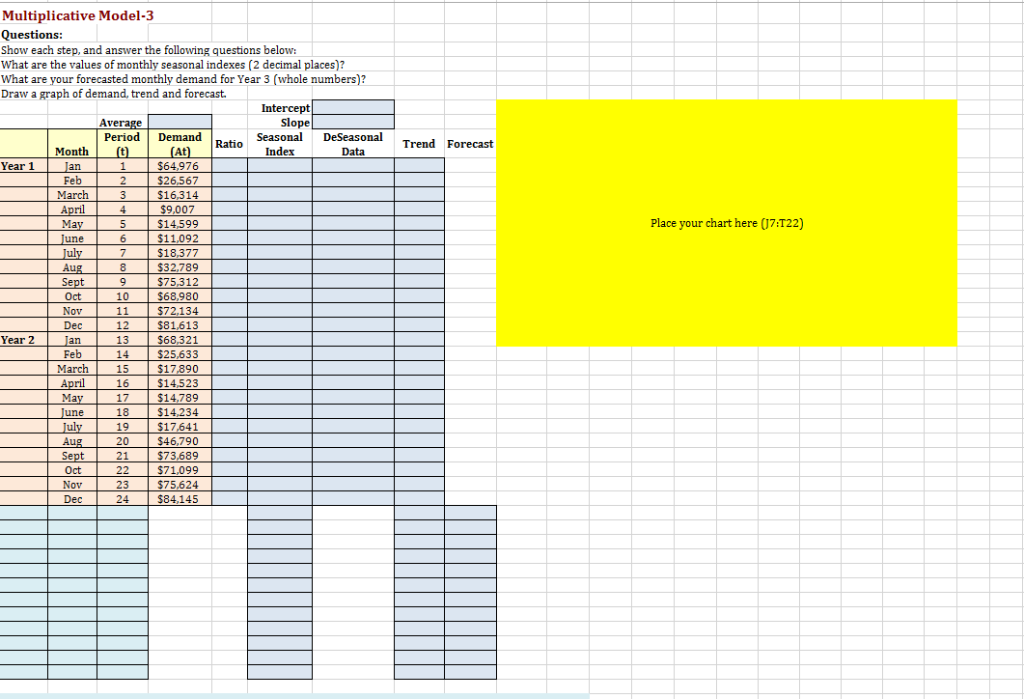
Please show formulas and range for chart. Multiplicative Model -3 Questions: Show each step, and answer the following questions below: places)? your forecasted monthly demand
Please show formulas and range for chart.
Step by Step Solution
There are 3 Steps involved in it
Step: 1

Get Instant Access to Expert-Tailored Solutions
See step-by-step solutions with expert insights and AI powered tools for academic success
Step: 2

Step: 3
Ace Your Homework with AI
Get the answers you need in no time with our AI-driven, step-by-step assistance
Get Started
A Complete Guide To Environmental Audits Self Policing For Environmental Protection
Authors: Elizabeth Glass Geltman
1st Edition
1570733813, 978-1570733819