

Question: please show formulas, Q4 (3 point): Build a combined column-line chart according to the following requirements. Household Expenditures Q4a (1 point): Calculate the total expenditure
please show formulas,
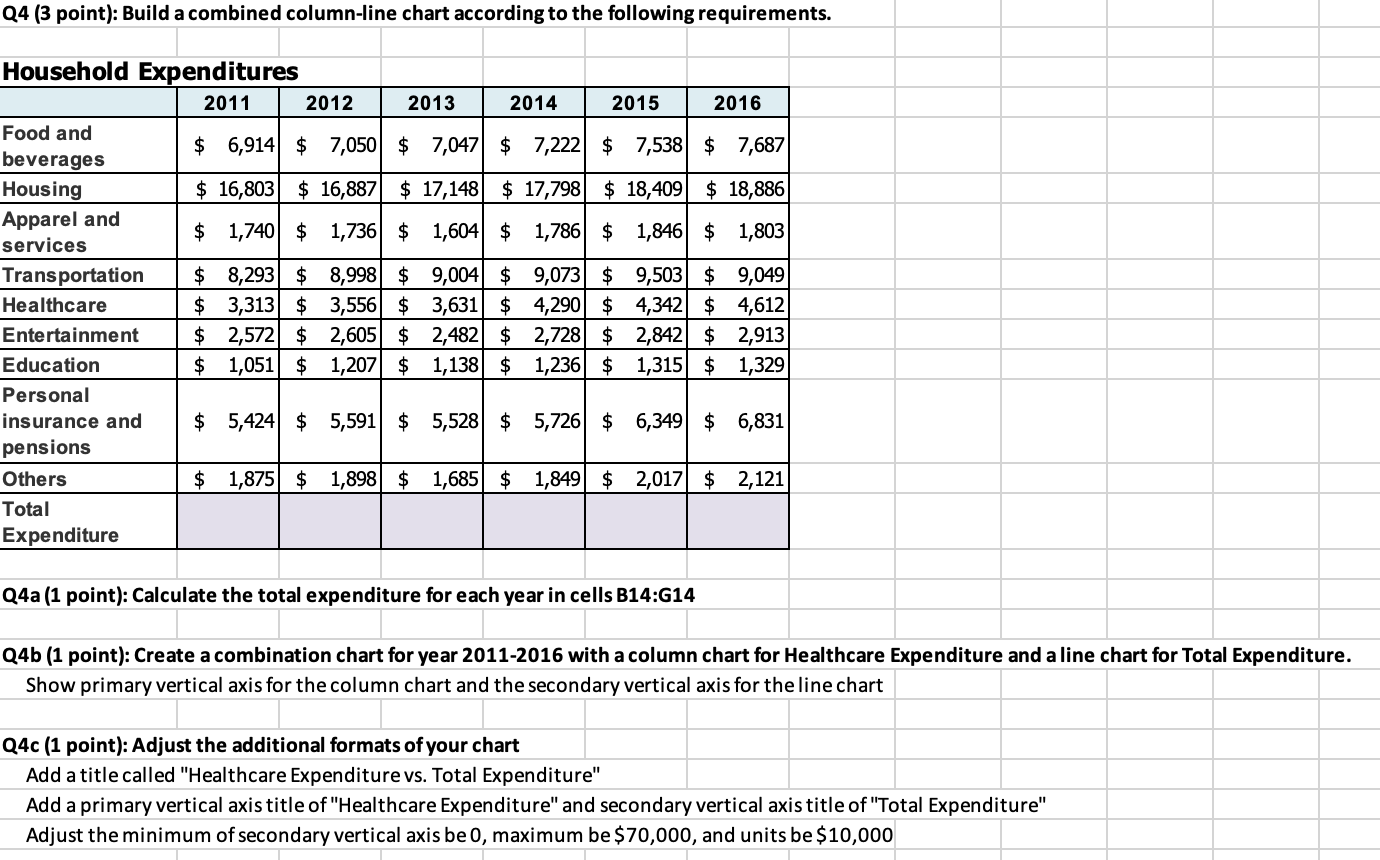
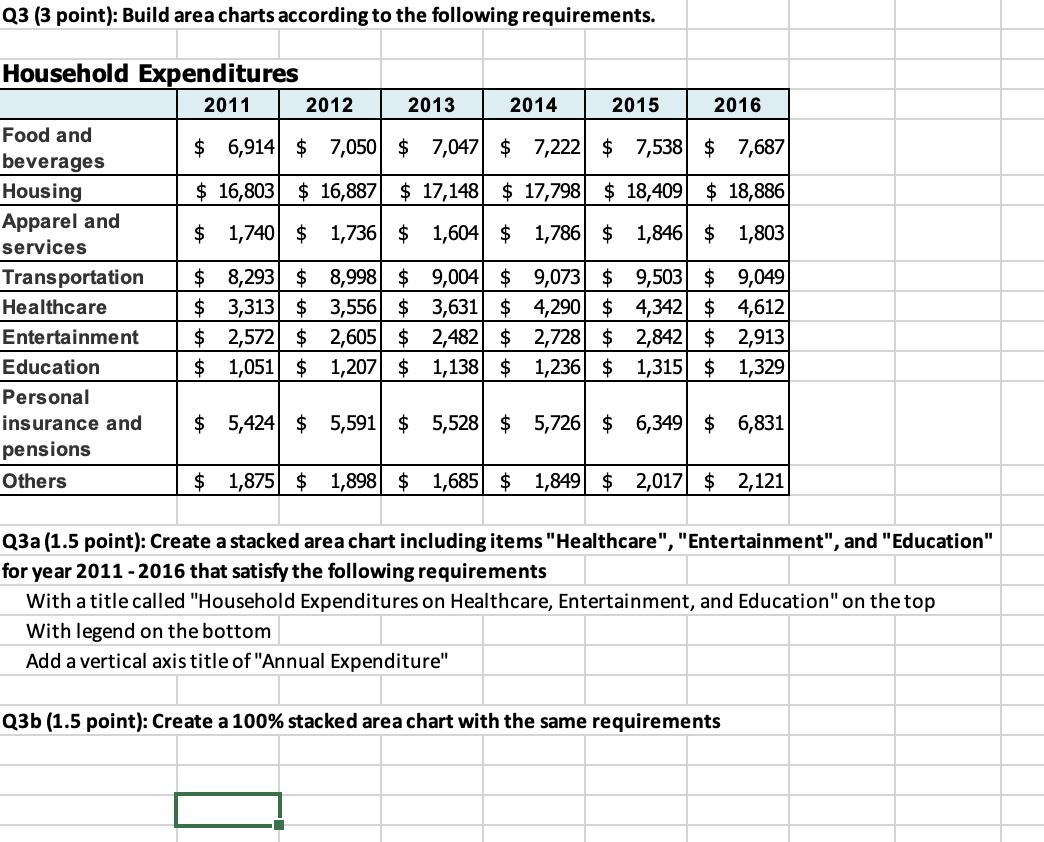
Q4 (3 point): Build a combined column-line chart according to the following requirements. Household Expenditures Q4a (1 point): Calculate the total expenditure for each year in cells B14:G14 Q4b (1 point): Create a combination chart for year 2011-2016 with a column chart for Healthcare Expenditure and a line chart for Total Expenditure. Show primary vertical axis for the column chart and the secondary vertical axis for the line chart Q4c (1 point): Adjust the additional formats of your chart Add a title called "Healthcare Expenditure vs. Total Expenditure" Add a primary vertical axis title of "Healthcare Expenditure" and secondary vertical axis title of "Total Expenditure" Adjust the minimum of secondary vertical axis be 0 , maximum be $70,000, and units be $10,000 Q3 (3 point): Build area charts according to the following requirements. Household Expenditures Q3a (1.5 point): Create a stacked area chart including items "Healthcare", "Entertainment", and "Education" for year 2011 - 2016 that satisfy the following requirements With a title called "Household Expenditures on Healthcare, Entertainment, and Education" on the top With legend on the bottom Add a vertical axis title of "Annual Expenditure" Q3b (1.5 point): Create a 100% stacked area chart with the same requirements Q4 (3 point): Build a combined column-line chart according to the following requirements. Household Expenditures Q4a (1 point): Calculate the total expenditure for each year in cells B14:G14 Q4b (1 point): Create a combination chart for year 2011-2016 with a column chart for Healthcare Expenditure and a line chart for Total Expenditure. Show primary vertical axis for the column chart and the secondary vertical axis for the line chart Q4c (1 point): Adjust the additional formats of your chart Add a title called "Healthcare Expenditure vs. Total Expenditure" Add a primary vertical axis title of "Healthcare Expenditure" and secondary vertical axis title of "Total Expenditure" Adjust the minimum of secondary vertical axis be 0 , maximum be $70,000, and units be $10,000 Q3 (3 point): Build area charts according to the following requirements. Household Expenditures Q3a (1.5 point): Create a stacked area chart including items "Healthcare", "Entertainment", and "Education" for year 2011 - 2016 that satisfy the following requirements With a title called "Household Expenditures on Healthcare, Entertainment, and Education" on the top With legend on the bottom Add a vertical axis title of "Annual Expenditure" Q3b (1.5 point): Create a 100% stacked area chart with the same requirements
Step by Step Solution
There are 3 Steps involved in it

Get step-by-step solutions from verified subject matter experts