

Answered step by step
Verified Expert Solution
Question
1 Approved Answer
Please show formulas! Stock Watcher Roger Hiles has created a basic stock watcher worksheet that to track the stocks he is interested in, which includes
Please show formulas!
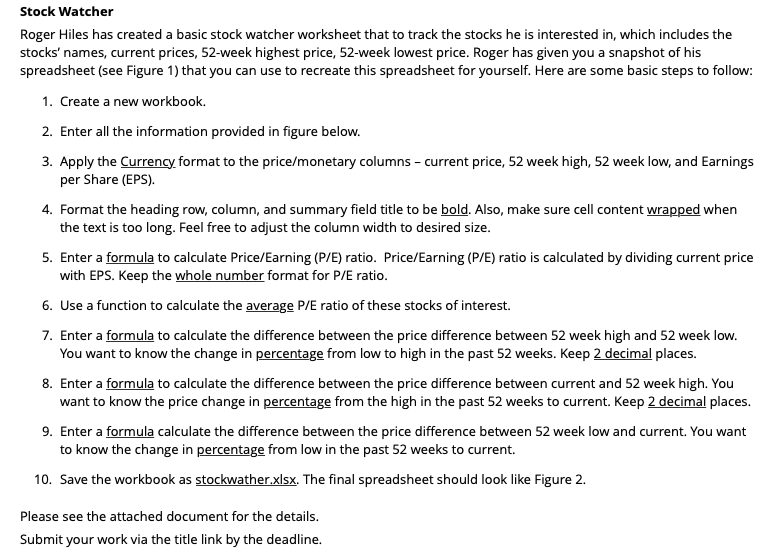
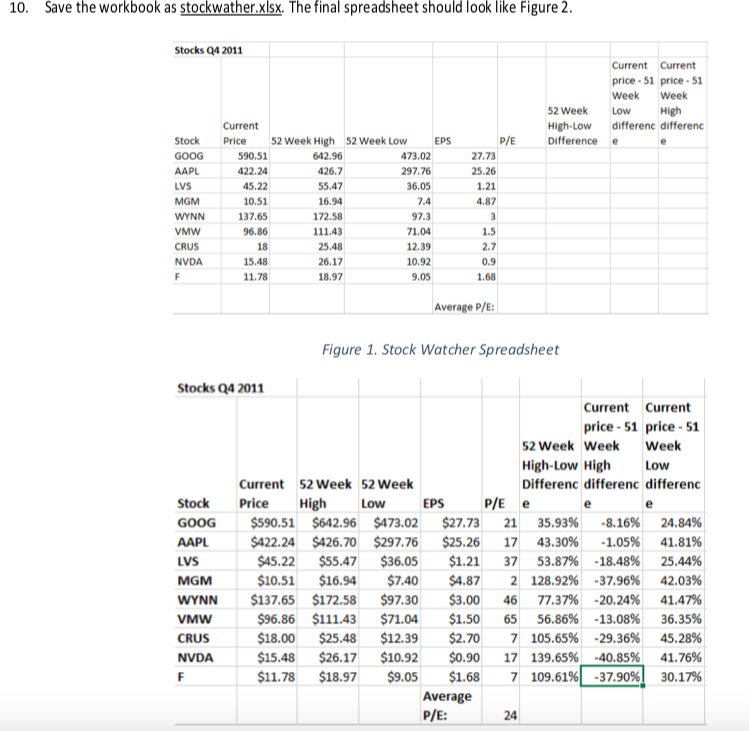
Stock Watcher Roger Hiles has created a basic stock watcher worksheet that to track the stocks he is interested in, which includes the stocks' names, current prices, 52-week highest price, 52-week lowest price. Roger has given you a snapshot of his spreadsheet (see Figure 1) that you can use to recreate this spreadsheet for yourself. Here are some basic steps to follow: 1. Create a new workbook. 2. Enter all the information provided in figure below. 3. Apply the Currency format to the price/monetary columns per Share (EPS) current price, 52 week high, 52 week low, and Earnings 4. Format the heading row, column, and summary field title to be bold. Also, make sure cell content wrapped when the text is too long. Feel free to adjust the column width to desired size. 5. Enter a formula to calculate Price/Earning (P/E) ratio. Price/Earning (P/E) ratio is calculated by dividing current price with EPS. Keep the whole number format for P/E ratio. 6. Use a function to calculate the average P/E ratio of these stocks of interest 7. Enter a formula to calculate the difference between the price difference between 52 week high and 52 week low. You want to know the change in percentage from low to high in the past 52 weeks. Keep 2 decimal places. 8. Enter a formula to calculate the difference between the price difference between current and 52 week high. You want to know the price change in percentage from the high in the past 52 weeks to current. Keep 2 decimal places 9. Enter a formula calculate the difference between the price difference between 52 week low and current. You want to know the change in percentage from low in the past 52 weeks to current. stockwather.xlsx. The final spreadsheet should look like Figure 2. 10. Save the workbook as Please see the attached document for the details. Submit your work via the title link by the deadline. Save the workbook as stockwather.xlsx. The final spreadsheet should look like Figure 2. 10. Stocks Q4 2011 Current Current price-51 price- 51 Week Week 52 Week High differenc differenc Low High-Low Current Stock 52 Week High P/E Difference e Price 52 Week Low EPS e GOOG 590.51 642.96 473.02 27.73 AAPL 422.24 426.7 297.76 25.26 LVS 45.22 55.47 36.05 1.21 MGM 10.51 74 4.87 16.94 WYNN 137.65 97.3 3 172.58 96.86 1.5 VMW 111.4 1.0 CRUS 25.48 12.39 18 2.7 NVDA 15.48 26.17 10.92 0.9 11.78 18.97 9.05 1.68 Average P/E Figure 1. Stock Watcher Spreadsheet Stocks Q4 2011 Current Current price-51 price-51 52 Week Week Week High-Low High Low Differenc differenc differenc Current 52 Week 52 Week Stock Price High P/E e Low EPS e $590.51 $642.96 $473.02 $27.73 21 35.93% 8.16%| 24.84% GOOG $422.24 $426.70 $297.76 $36.05 $7.40 $25.26 17 43.30% -1.05% 41.81% AAPL $45.22 $55.47 $1.21 53.87% -18.48% 37 25.44% LVS 42.03% $10.51 $16.94 $137.65 $172.58 $4.87 2 128.92% -37.96% MGM $97.30 $3.00 77.37% -20.24% 41.47% WYNN 46 $96.86 $111.43 $71.04 $1.50 56.86% -13.08% VMW 65 36.35% $18.00 $25.48 $12.39 $10.92 $2.70 7 105.65% -29.36% 45.28% CRUS $15.48 $26.17 $0.90 17 139.65% -40.85% 41.76% NVDA 7 109.61% -37.90% $11.78 E $18.97 $9.05 $1.68 30.17% Average P/E: 24Step by Step Solution
There are 3 Steps involved in it
Step: 1

Get Instant Access to Expert-Tailored Solutions
See step-by-step solutions with expert insights and AI powered tools for academic success
Step: 2

Step: 3
Ace Your Homework with AI
Get the answers you need in no time with our AI-driven, step-by-step assistance
Get Started
Risk Based Management Led Audit Driven Safety Management Systems
Authors: Ron C. McKinnon
1st Edition
1498767923, 978-1498767927