Please show formulas, the income statement and balance sheet should correlate
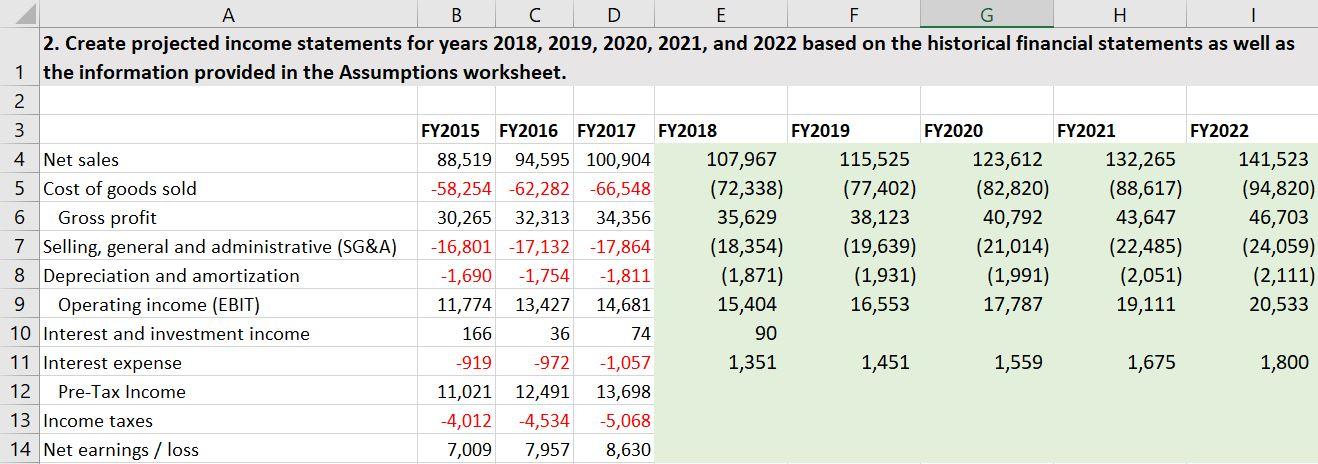
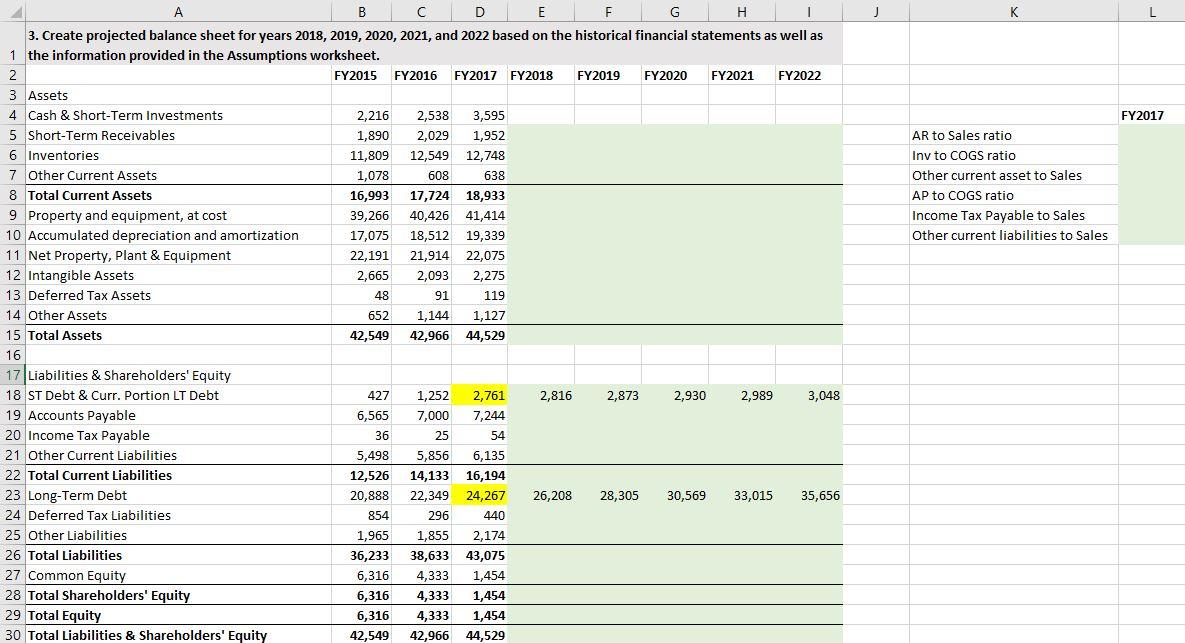
A B C D E F G . 1 2. Create projected income statements for years 2018, 2019, 2020, 2021, and 2022 based on the historical financial statements as well as 1 the information provided in the Assumptions worksheet. 2 3 FY2015 FY2016 FY2017 FY2018 FY2019 FY2020 FY2021 FY2022 4 Net sales 88,519 94,595 100,904 107,967 115,525 123,612 132,265 141,523 5 Cost of goods sold -58,254 -62,282 -66,548 (72,338) (77,402) (82,820) (88,617) (94,820) 6 Gross profit 30,265 32,313 34,356 35,629 38,123 40,792 43,647 46,703 7 Selling, general and administrative (SG&A) -16,801 -17,132 -17,864 (18,354) (19,639) (21,014) (22,485) (24,059) 8 Depreciation and amortization -1,690 -1,754 -1,811 (1,871) (1,931) (1,991) (2,051) (2,111) 9 Operating income (EBIT) 11,774 13,427 14,681 15,404 16,553 17,787 19,111 20,533 10 Interest and investment income 166 36 74 90 11 Interest expense -919 -972 -1,057 1,351 1,451 1,559 1,675 1,800 12 Pre-Tax Income 11,021 12,491 13,698 13 Income taxes -4,012 -4,534 -5,068 14 Net earnings / loss 7,009 7,957 8,630 K L FY2017 AR to Sales ratio Inv to COGS ratio Other current asset to Sales AP to COGS ratio Income Tax Payable to Sales Other current liabilities to Sales A D E F G H 3. Create projected balance sheet for years 2018, 2019, 2020, 2021, and 2022 based on the historical financial statements as well as 1 the information provided in the Assumptions worksheet. 2 FY2015 FY2016 FY2017 FY2018 FY2019 FY2020 FY2021 FY2022 3 Assets 4 Cash & Short-Term Investments 2,216 2,538 3,595 5 Short-Term Receivables 1,890 2,029 1,952 6 Inventories 11,809 12,549 12,748 7 Other Current Assets 1,078 608 638 8 Total Current Assets 16,993 17,724 18,933 9 Property and equipment, at cost 39,266 40,426 41,414 10 Accumulated depreciation and amortization 17,075 18,512 19,339 11 Net Property, Plant & Equipment 22,191 21,914 22,075 12 Intangible Assets 2,665 2,093 2,275 13 Deferred Tax Assets 48 91 119 14 Other Assets 652 1,144 1,127 15 Total Assets 42,549 42,966 44,529 16 17 Liabilities & Shareholders' Equity 18 ST Debt & Curr. Portion LT Debt 427 1,252 2,761 2,816 2,873 2,930 2,989 3,048 19 Accounts Payable 6,565 7,000 7,244 20 Income Tax Payable 36 25 54 21 Other Current Liabilities 5,498 5,856 6,135 22 Total Current Liabilities 12,526 14,133 16,194 23 Long-Term Debt 20,888 22,349 24,267 26,208 28,305 30,569 33,015 35,656 24 Deferred Tax Liabilities 854 296 440 25 Other Liabilities 1,965 1,855 2,174 26 Total Liabilities 36,233 38,633 43,075 27 Common Equity 6,316 4,333 1,454 28 Total Shareholders' Equity 6,316 1,454 29 Total Equity 6,316 4,333 1,454 30 Total Liabilities & Shareholders' Equity 42,549 42,966 44,529 4,333 A D E G H 1 J L BC K 1 Operating Assumptions: 2 Sales will grow at 7% per year in the next 5 years. 3 Cost of sales will be 67% of total sales in the next 5 years. 4 SG&A will be 17% of total sales in the next 5 years. 5 Annual Depreciation and Amortization increases by 60 in each of the next 5 years. 6 Capital expenditure (Capex) will be 1,200 in each of the next 5 years. 7 8 Income Statement Assumptions: 9 Interest and investment income is 2.5% of the ending Cash & Short-Term Investments in the previous year. 10 Interest rate on debt is 5% based on the ending ST Debt & Curr. Portion LT Debt and Long-Term Debt in the previous year. 11 Tax rate is assumed to be 21%. 12 1,184 million common shares outstanding. 13 Dividend payout ratio = 50% 14 15 Working Capital Assumptions 16 In the next 5 years, AR to Sales ratio remains the same as that in the most recent fiscal year (FY2017). 17 in the next 5 years, Inventory to COGS ratio remains the same as that in the most recent fiscal year (FY2017). 18 In the next 5 years, other current assets to Sales ratio remains the same as that in the most recent fiscal year (FY2017). 19 In the next 5 years, AP to COGS ratio remains the same as that in the most recent fiscal year (FY2017). 20 In the next 5 years, Income Tax Payable to Sales ratio remains the same as that in the most recent fiscal year (FY2017). 21 in the next 5 years, other current liabilities to Sales ratio remains the same as that in the most recent fiscal year (FY2017). 22 23 Assets Assumptions: 24 Intangible assets grows at the same rate as sales (7%) in the next 5 years 25 Deferred tax assets grows at the same rate as sales (7%) in the next 5 years 26 Other assets grows at the same rate as sales (7%) in the next 5 years 27 Deferred tax liabilities grows at the same rate as sales (7%) in the next 5 years 28 Other liabilities grows at the same rate as sales (7%) in the next 5 years 29 30 Debt Assumptions 31 Short-term debt increases by 2% in each year. 32 Long-term debt decreases by 8% each year. 33 34 Valuation Assumptions 35 Future annual cash flow from assets (CFFA) growth rate (beyond 2022) is assumed to be 5%. 36 Weighted average cost of capital (WACC) is 9%. A B C D E F G . 1 2. Create projected income statements for years 2018, 2019, 2020, 2021, and 2022 based on the historical financial statements as well as 1 the information provided in the Assumptions worksheet. 2 3 FY2015 FY2016 FY2017 FY2018 FY2019 FY2020 FY2021 FY2022 4 Net sales 88,519 94,595 100,904 107,967 115,525 123,612 132,265 141,523 5 Cost of goods sold -58,254 -62,282 -66,548 (72,338) (77,402) (82,820) (88,617) (94,820) 6 Gross profit 30,265 32,313 34,356 35,629 38,123 40,792 43,647 46,703 7 Selling, general and administrative (SG&A) -16,801 -17,132 -17,864 (18,354) (19,639) (21,014) (22,485) (24,059) 8 Depreciation and amortization -1,690 -1,754 -1,811 (1,871) (1,931) (1,991) (2,051) (2,111) 9 Operating income (EBIT) 11,774 13,427 14,681 15,404 16,553 17,787 19,111 20,533 10 Interest and investment income 166 36 74 90 11 Interest expense -919 -972 -1,057 1,351 1,451 1,559 1,675 1,800 12 Pre-Tax Income 11,021 12,491 13,698 13 Income taxes -4,012 -4,534 -5,068 14 Net earnings / loss 7,009 7,957 8,630 K L FY2017 AR to Sales ratio Inv to COGS ratio Other current asset to Sales AP to COGS ratio Income Tax Payable to Sales Other current liabilities to Sales A D E F G H 3. Create projected balance sheet for years 2018, 2019, 2020, 2021, and 2022 based on the historical financial statements as well as 1 the information provided in the Assumptions worksheet. 2 FY2015 FY2016 FY2017 FY2018 FY2019 FY2020 FY2021 FY2022 3 Assets 4 Cash & Short-Term Investments 2,216 2,538 3,595 5 Short-Term Receivables 1,890 2,029 1,952 6 Inventories 11,809 12,549 12,748 7 Other Current Assets 1,078 608 638 8 Total Current Assets 16,993 17,724 18,933 9 Property and equipment, at cost 39,266 40,426 41,414 10 Accumulated depreciation and amortization 17,075 18,512 19,339 11 Net Property, Plant & Equipment 22,191 21,914 22,075 12 Intangible Assets 2,665 2,093 2,275 13 Deferred Tax Assets 48 91 119 14 Other Assets 652 1,144 1,127 15 Total Assets 42,549 42,966 44,529 16 17 Liabilities & Shareholders' Equity 18 ST Debt & Curr. Portion LT Debt 427 1,252 2,761 2,816 2,873 2,930 2,989 3,048 19 Accounts Payable 6,565 7,000 7,244 20 Income Tax Payable 36 25 54 21 Other Current Liabilities 5,498 5,856 6,135 22 Total Current Liabilities 12,526 14,133 16,194 23 Long-Term Debt 20,888 22,349 24,267 26,208 28,305 30,569 33,015 35,656 24 Deferred Tax Liabilities 854 296 440 25 Other Liabilities 1,965 1,855 2,174 26 Total Liabilities 36,233 38,633 43,075 27 Common Equity 6,316 4,333 1,454 28 Total Shareholders' Equity 6,316 1,454 29 Total Equity 6,316 4,333 1,454 30 Total Liabilities & Shareholders' Equity 42,549 42,966 44,529 4,333 A D E G H 1 J L BC K 1 Operating Assumptions: 2 Sales will grow at 7% per year in the next 5 years. 3 Cost of sales will be 67% of total sales in the next 5 years. 4 SG&A will be 17% of total sales in the next 5 years. 5 Annual Depreciation and Amortization increases by 60 in each of the next 5 years. 6 Capital expenditure (Capex) will be 1,200 in each of the next 5 years. 7 8 Income Statement Assumptions: 9 Interest and investment income is 2.5% of the ending Cash & Short-Term Investments in the previous year. 10 Interest rate on debt is 5% based on the ending ST Debt & Curr. Portion LT Debt and Long-Term Debt in the previous year. 11 Tax rate is assumed to be 21%. 12 1,184 million common shares outstanding. 13 Dividend payout ratio = 50% 14 15 Working Capital Assumptions 16 In the next 5 years, AR to Sales ratio remains the same as that in the most recent fiscal year (FY2017). 17 in the next 5 years, Inventory to COGS ratio remains the same as that in the most recent fiscal year (FY2017). 18 In the next 5 years, other current assets to Sales ratio remains the same as that in the most recent fiscal year (FY2017). 19 In the next 5 years, AP to COGS ratio remains the same as that in the most recent fiscal year (FY2017). 20 In the next 5 years, Income Tax Payable to Sales ratio remains the same as that in the most recent fiscal year (FY2017). 21 in the next 5 years, other current liabilities to Sales ratio remains the same as that in the most recent fiscal year (FY2017). 22 23 Assets Assumptions: 24 Intangible assets grows at the same rate as sales (7%) in the next 5 years 25 Deferred tax assets grows at the same rate as sales (7%) in the next 5 years 26 Other assets grows at the same rate as sales (7%) in the next 5 years 27 Deferred tax liabilities grows at the same rate as sales (7%) in the next 5 years 28 Other liabilities grows at the same rate as sales (7%) in the next 5 years 29 30 Debt Assumptions 31 Short-term debt increases by 2% in each year. 32 Long-term debt decreases by 8% each year. 33 34 Valuation Assumptions 35 Future annual cash flow from assets (CFFA) growth rate (beyond 2022) is assumed to be 5%. 36 Weighted average cost of capital (WACC) is 9%