Answered step by step
Verified Expert Solution
Question
1 Approved Answer
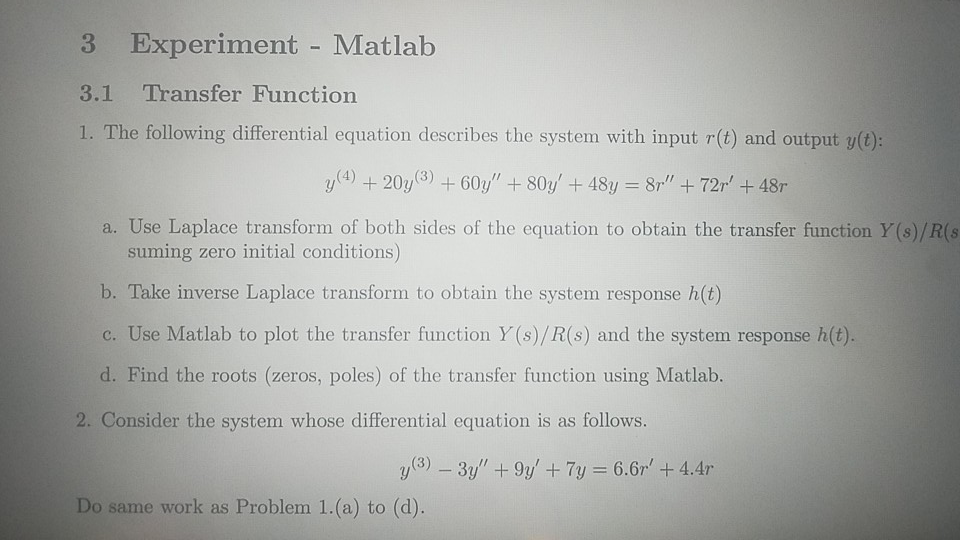
please show graphs with matlab code 3 Experiment - Matlab 3.1 Transfer Function I. The following differential equation describes the system with input r(t) and

please show graphs with matlab code
3 Experiment - Matlab 3.1 Transfer Function I. The following differential equation describes the system with input r(t) and output y(t): y(4) + 20y(3) + 60y', + 80y, + 48y = 8r" + 72r, +48r a. Use Laplace transform of both sides of the equation to obtain the transfer function Y(s)/R(s suming zero initial conditions) tranfor a otem nspaue c. Use Matlab to plot the transfer function Y (s)/R(s) and the system response h(t). d. Find the roots (zeros, poles) of the transfer function using Matlab. 2. Consider the system whose differential equation is as follows. y(3) -3'9y'7y 6.6r' +4.4r Do same work as Problem 1.(a) to (d)Step by Step Solution
There are 3 Steps involved in it
Step: 1

Get Instant Access to Expert-Tailored Solutions
See step-by-step solutions with expert insights and AI powered tools for academic success
Step: 2

Step: 3

Ace Your Homework with AI
Get the answers you need in no time with our AI-driven, step-by-step assistance
Get Started


