Answered step by step
Verified Expert Solution
Link Copied!

Question

1 Approved Answer

Please show hand calculations if possible. Thank you! Chapter 14 - Correlation & Regression Each observation represents a neighborhood. The X variable is SES measured

Please show hand calculations if possible. Thank you!
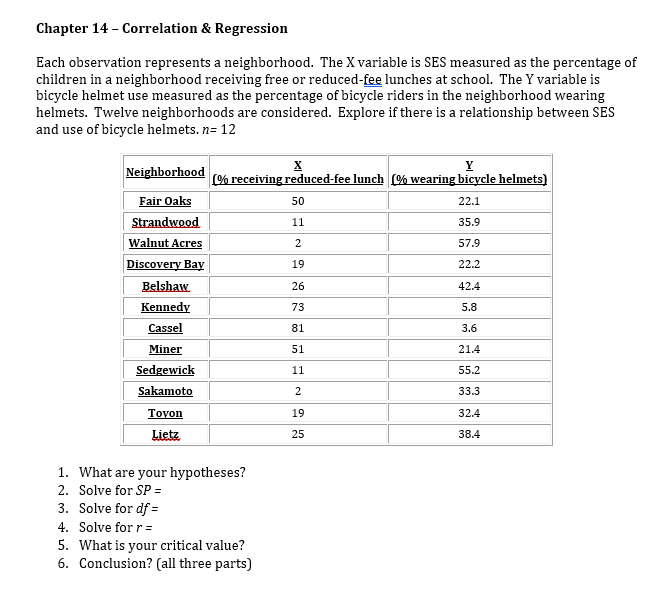
image text in transcribed
Chapter 14 - Correlation & Regression Each observation represents a neighborhood. The X variable is SES measured as the percentage of children in a neighborhood receiving free or reduced-fee lunches at school. The Y variable is bicycle helmet use measured as the percentage of bicycle riders in the neighborhood wearing helmets. Twelve neighborhoods are considered. Explore if there is a relationship between SES and use of bicycle helmets. n= 12 Neighborhood X Y (% receiving reduced-fee lunch (% wearing bicycle helmets) Fair Oaks 50 22.1 Strandwood 11 35.9 Walnut Acres 2 57.9 Discovery Bay 19 22.2 Belshaw 26 42.4 Kennedy 73 5.8 Cassel 81 3.6 Miner 51 21.4 Sedgewick 11 55.2 Sakamoto 2 33.3 Toyon 19 32.4 Lietz 25 38.4 1. What are your hypotheses? 2. Solve for SP = 3. Solve for df = 4. Solve for r = 5. What is your critical value? 6. Conclusion? (all three parts)

Step by Step Solution

There are 3 Steps involved in it

Step: 1

blur-text-image

Get Instant Access to Expert-Tailored Solutions

See step-by-step solutions with expert insights and AI powered tools for academic success

Step: 2

blur-text-image

Step: 3

blur-text-image

Ace Your Homework with AI

Get the answers you need in no time with our AI-driven, step-by-step assistance

Get Started

Recommended Textbook for

Larson Algebra 1 California

Authors: Ron Larson, Laurie Boswell, Timothy D. Kanold, Lee Stiff

1st Edition

0618811761, 9780618811762

More Books

Students also viewed these Mathematics questions

Question

4 How can a hotel be marketed effectively on the Internet?

Answered: 1 week ago