Answered step by step
Verified Expert Solution
Question
1 Approved Answer
Please show how to do 1e with R and 1a-1d all done with R please and show codes and everything used thank u 4.1.11. This


Please show how to do 1e with R and 1a-1d all done with R please and show codes and everything used thank u
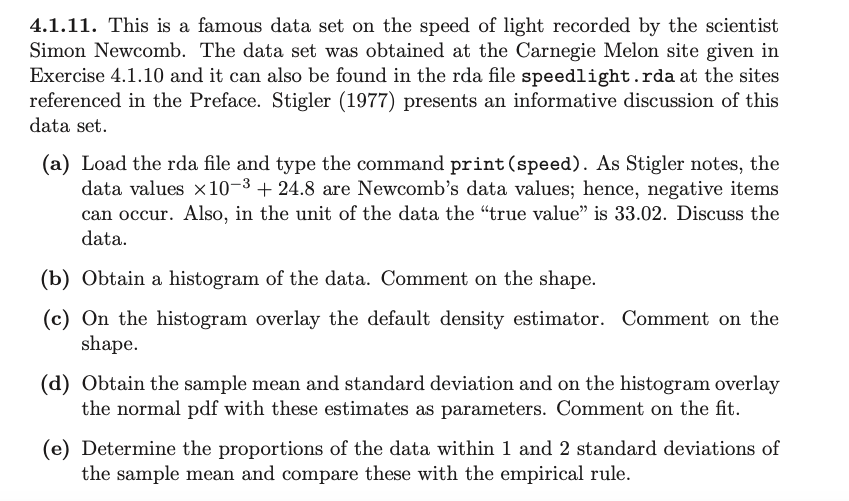
4.1.11. This is a famous data set on the speed of light recorded by the scientist Simon Newcomb. The data set was obtained at the Carnegie Melon site given in Exercise 4.1.10 and it can also be found in the rda file speedlight.rda at the sites referenced in the Preface. Stigler (1977) presents an informative discussion of this data set. (a) Load the rda file and type the command print (speed). As Stigler notes, the data values x10-3 + 24.8 are Newcomb's data values; hence, negative items can occur. Also, in the unit of the data the "true value is 33.02. Discuss the data. (b) Obtain a histogram of the data. Comment on the shape. (c) On the histogram overlay the default density estimator. Comment on the shape. (d) Obtain the sample mean and standard deviation and on the histogram overlay the normal pdf with these estimates as parameters. Comment on the fit. (e) Determine the proportions of the data within 1 and 2 standard deviations of the sample mean and compare these with the empirical rule. > sort(speed) [1] -44 -2 16 [18] 24 25 25 [35] 28 28 28 [52] 32 32 32 16 19 20 21 21 22 22 23 23 23 24 24 24 24 25 25 25 26 26 26 26 26 27 27 27 27 27 27 28 28 28 28 29 29 29 29 29 30 30 30 31 31 32 32 33 33 34 36 36 36 36 37 39 40 4.1.11. This is a famous data set on the speed of light recorded by the scientist Simon Newcomb. The data set was obtained at the Carnegie Melon site given in Exercise 4.1.10 and it can also be found in the rda file speedlight.rda at the sites referenced in the Preface. Stigler (1977) presents an informative discussion of this data set. (a) Load the rda file and type the command print (speed). As Stigler notes, the data values x10-3 + 24.8 are Newcomb's data values; hence, negative items can occur. Also, in the unit of the data the "true value is 33.02. Discuss the data. (b) Obtain a histogram of the data. Comment on the shape. (c) On the histogram overlay the default density estimator. Comment on the shape. (d) Obtain the sample mean and standard deviation and on the histogram overlay the normal pdf with these estimates as parameters. Comment on the fit. (e) Determine the proportions of the data within 1 and 2 standard deviations of the sample mean and compare these with the empirical rule. > sort(speed) [1] -44 -2 16 [18] 24 25 25 [35] 28 28 28 [52] 32 32 32 16 19 20 21 21 22 22 23 23 23 24 24 24 24 25 25 25 26 26 26 26 26 27 27 27 27 27 27 28 28 28 28 29 29 29 29 29 30 30 30 31 31 32 32 33 33 34 36 36 36 36 37 39 40Step by Step Solution
There are 3 Steps involved in it
Step: 1

Get Instant Access to Expert-Tailored Solutions
See step-by-step solutions with expert insights and AI powered tools for academic success
Step: 2

Step: 3

Ace Your Homework with AI
Get the answers you need in no time with our AI-driven, step-by-step assistance
Get Started


