Answered step by step
Verified Expert Solution
Question
1 Approved Answer
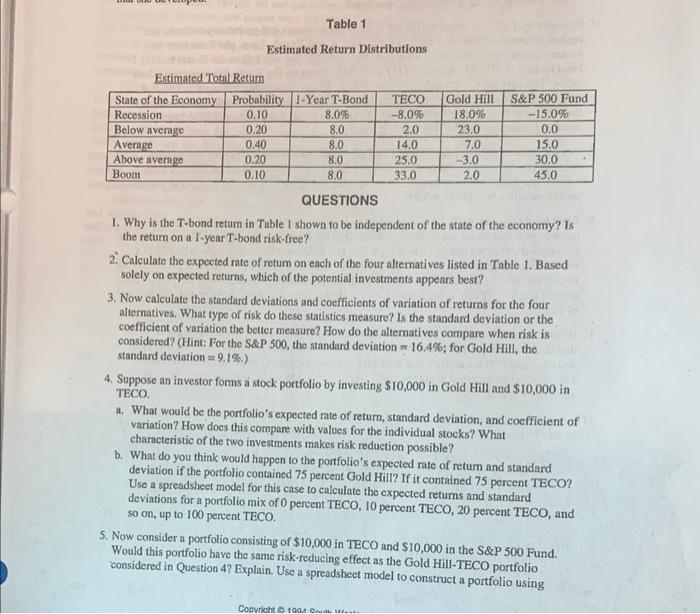
Please show how to do 2 and 3 in excel Table 1 Estimated Return Distributions Estimated TotalRetum QUESTIONS 1. Why is the T-bond retum in
Please show how to do 2 and 3 in excel 
Table 1 Estimated Return Distributions Estimated TotalRetum QUESTIONS 1. Why is the T-bond retum in Table 1 shown to be independent of the state of the economy? Is the return on a l-year T-bond risk-free? 2. Calculate the expected rate of retum on each of the four altematives listed in Table 1. Based solely on expected returns, which of the potential investments appears best? 3. Now calculate the standard deviations and coefficients of variation of returns for the four alternatives. What type of risk do these statistics measure? Is the standard deviation or the coefficient of variation the better measure? How do the alternatives compare when risk is considered? (Hint: For the S\&P 500, the standard deviation =16.4%; for Gold Hill, the standard deviation =9.1% ) 4. Suppose an investor foms a stock portfolio by investing $10,000 in Gold Hill and $10,000 in TECO. a. What would be the portfolio's expected rate of return, standard deviation, and coefficient of variation? How does this compare with values for the individual stocks? What characteristic of the two investments makes risk reduction possible? b. What do you think would happen to the portfolio's expected rate of retum and standard deviation if the portfolio contained 75 percent Gold Hill? If it contained 75 percent TECO? Use a spreadsheet model for this case to calculate the expected returns and standard deviations for a portfolio mix of 0 percent TECO, 10 percent TECO, 20 percent TECO, and so on, up to 100 percent TECO. 5. Now consider a portfolio consisting of $10,000 in TECO and $10,000 in the S\&P 500 Fund. Would this portfolio have the same risk-reducing effect as the Gold Hill-TECO portfolio considered in Question 4 ? Explain. Use a spreadsheet model to construct a portfolio using Table 1 Estimated Return Distributions Estimated TotalRetum QUESTIONS 1. Why is the T-bond retum in Table 1 shown to be independent of the state of the economy? Is the return on a l-year T-bond risk-free? 2. Calculate the expected rate of retum on each of the four altematives listed in Table 1. Based solely on expected returns, which of the potential investments appears best? 3. Now calculate the standard deviations and coefficients of variation of returns for the four alternatives. What type of risk do these statistics measure? Is the standard deviation or the coefficient of variation the better measure? How do the alternatives compare when risk is considered? (Hint: For the S\&P 500, the standard deviation =16.4%; for Gold Hill, the standard deviation =9.1% ) 4. Suppose an investor foms a stock portfolio by investing $10,000 in Gold Hill and $10,000 in TECO. a. What would be the portfolio's expected rate of return, standard deviation, and coefficient of variation? How does this compare with values for the individual stocks? What characteristic of the two investments makes risk reduction possible? b. What do you think would happen to the portfolio's expected rate of retum and standard deviation if the portfolio contained 75 percent Gold Hill? If it contained 75 percent TECO? Use a spreadsheet model for this case to calculate the expected returns and standard deviations for a portfolio mix of 0 percent TECO, 10 percent TECO, 20 percent TECO, and so on, up to 100 percent TECO. 5. Now consider a portfolio consisting of $10,000 in TECO and $10,000 in the S\&P 500 Fund. Would this portfolio have the same risk-reducing effect as the Gold Hill-TECO portfolio considered in Question 4 ? Explain. Use a spreadsheet model to construct a portfolio using 
Step by Step Solution
There are 3 Steps involved in it
Step: 1

Get Instant Access to Expert-Tailored Solutions
See step-by-step solutions with expert insights and AI powered tools for academic success
Step: 2

Step: 3

Ace Your Homework with AI
Get the answers you need in no time with our AI-driven, step-by-step assistance
Get Started


