Answered step by step
Verified Expert Solution
Question
1 Approved Answer
please show how to do in excel Description Many civil engineering projects have a construction component for which the duration of each phase of the
please show how to do in excel 

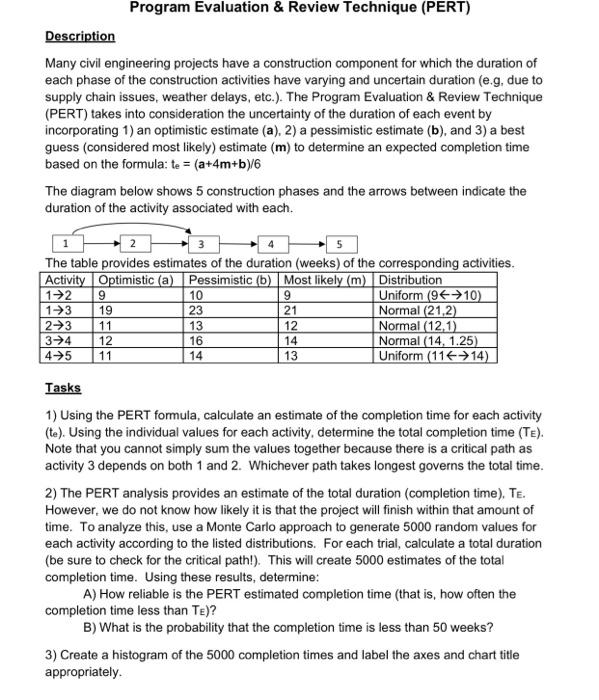
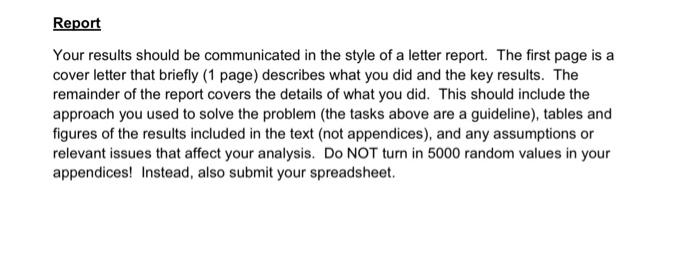
Description Many civil engineering projects have a construction component for which the duration of each phase of the construction activities have varying and uncertain duration (e.g, due to supply chain issues, weather delays, etc.). The Program Evaluation \& Review Technique (PERT) takes into consideration the uncertainty of the duration of each event by incorporating 1) an optimistic estimate (a), 2) a pessimistic estimate (b), and 3) a best guess (considered most likely) estimate (m) to determine an expected completion time based on the formula: te=(a+4m+b)/6 The diagram below shows 5 construction phases and the arrows between indicate the duration of the activity associated with each. The table provides estimates of the duration (weeks) of the corresponding activities. Tasks 1) Using the PERT formula, calculate an estimate of the completion time for each activity (te). Using the individual values for each activity, determine the total completion time (TE). Note that you cannot simply sum the values together because there is a critical path as activity 3 depends on both 1 and 2 . Whichever path takes longest governs the total time. 2) The PERT analysis provides an estimate of the total duration (completion time). TE. However, we do not know how likely it is that the project will finish within that amount of time. To analyze this, use a Monte Carlo approach to generate 5000 random values for each activity according to the listed distributions. For each trial, calculate a total duration (be sure to check for the critical path!). This will create 5000 estimates of the total completion time. Using these results, determine: A) How reliable is the PERT estimated completion time (that is, how often the completion time less than TE )? B) What is the probability that the completion time is less than 50 weeks? 3) Create a histogram of the 5000 completion times and label the axes and chart title appropriately. Report Your results should be communicated in the style of a letter report. The first page is a cover letter that briefly ( 1 page) describes what you did and the key results. The remainder of the report covers the details of what you did. This should include the approach you used to solve the problem (the tasks above are a guideline), tables and figures of the results included in the text (not appendices), and any assumptions or relevant issues that affect your analysis. Do NOT turn in 5000 random values in your appendices! Instead, also submit your spreadsheet 

Step by Step Solution
There are 3 Steps involved in it
Step: 1

Get Instant Access to Expert-Tailored Solutions
See step-by-step solutions with expert insights and AI powered tools for academic success
Step: 2

Step: 3

Ace Your Homework with AI
Get the answers you need in no time with our AI-driven, step-by-step assistance
Get Started


