

Question: Please show how to do on excel, thank you ! d. What is the standard error of the estimate? (Round your answer to 2 decimal
Please show how to do on excel, thank you !
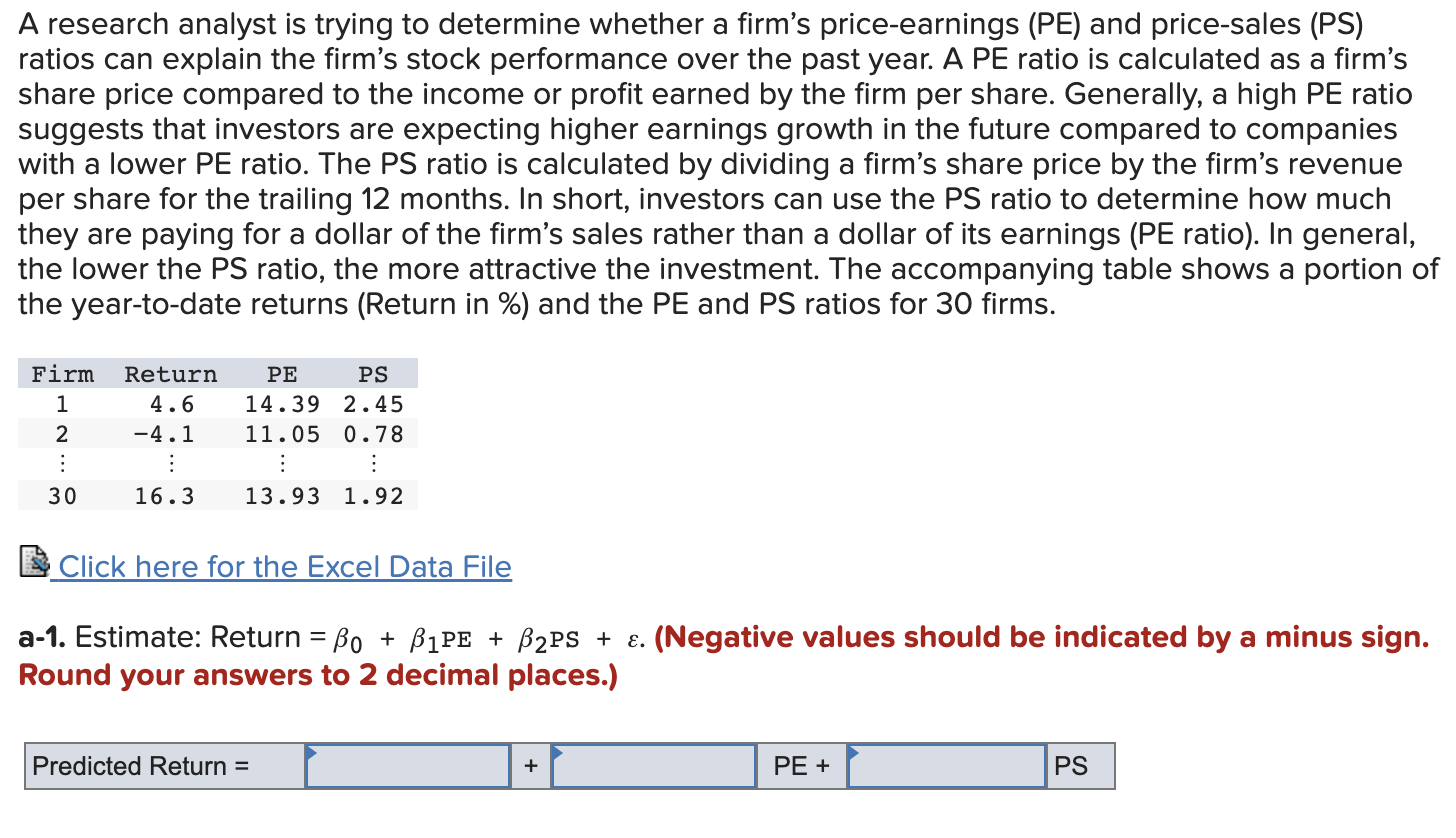
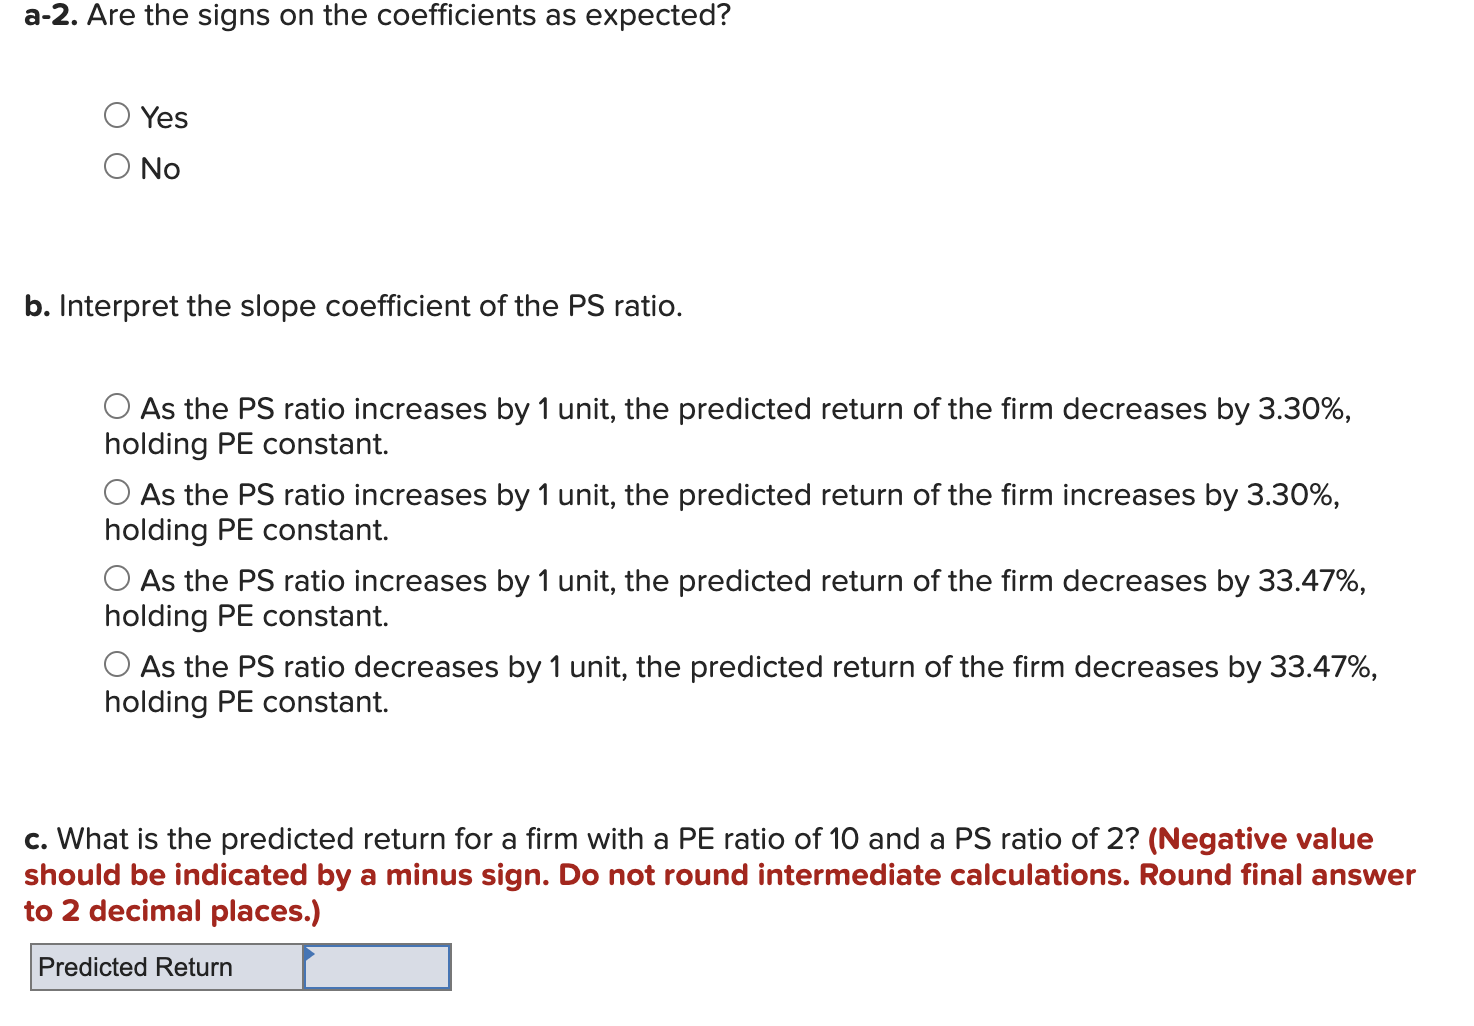
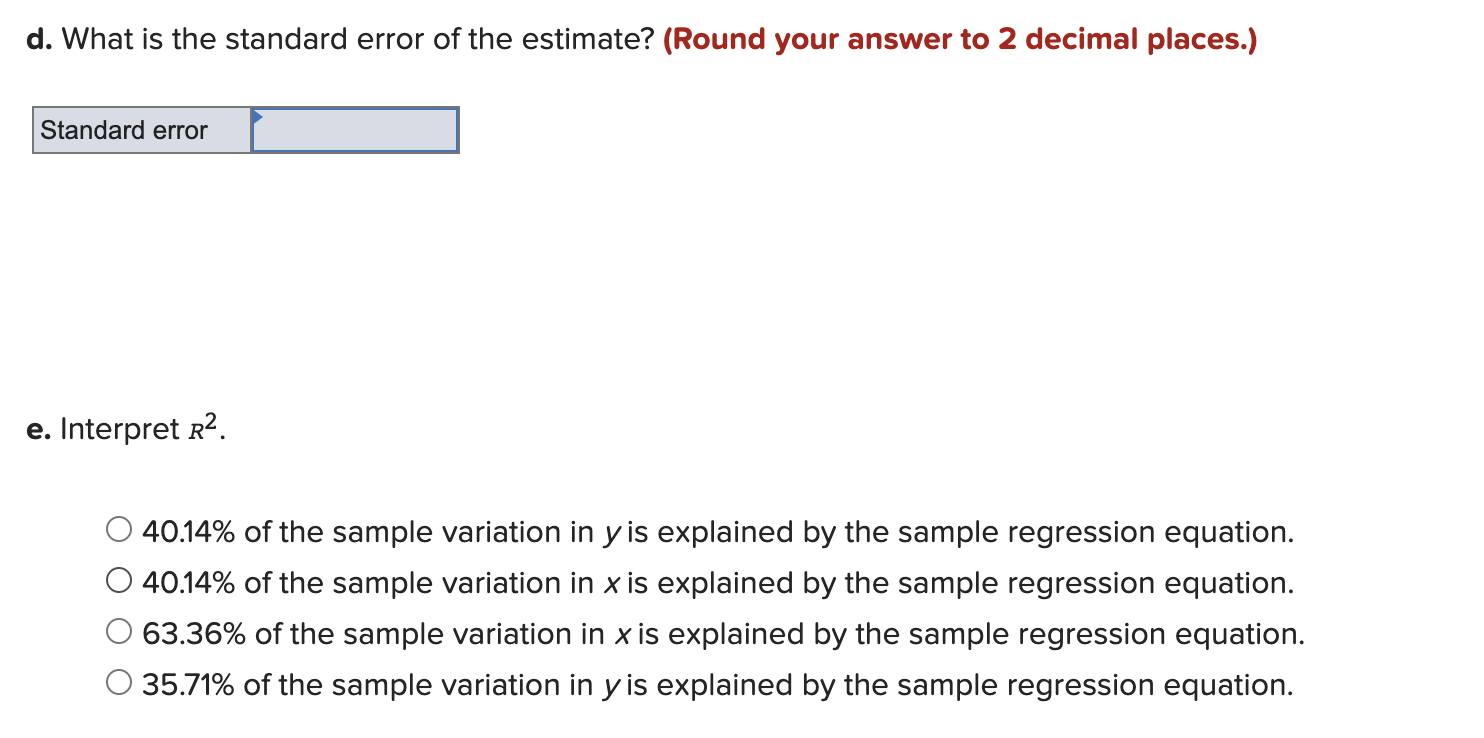
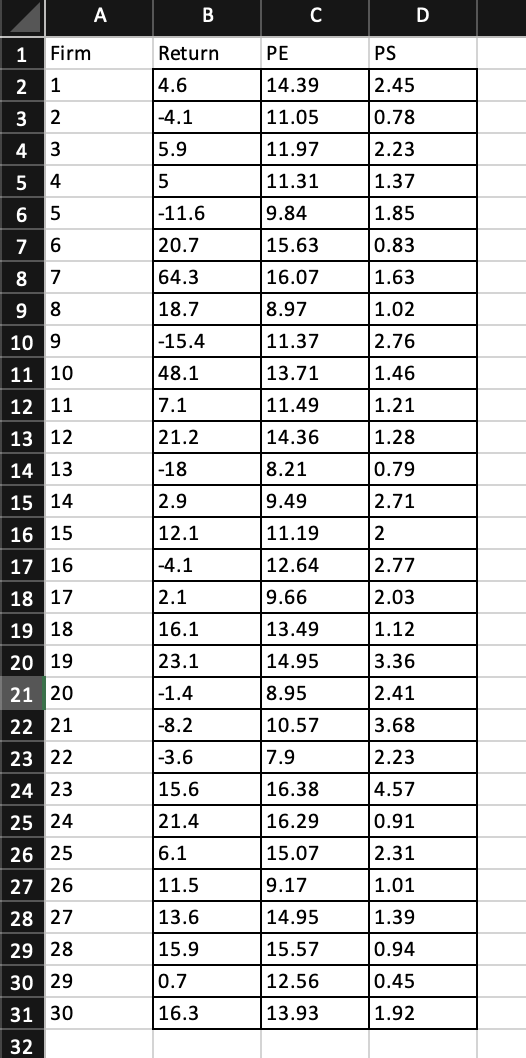
d. What is the standard error of the estimate? (Round your answer to 2 decimal places.) e. Interpret \\( R^{2} \\). \40.14 of the sample variation in \\( y \\) is explained by the sample regression equation \40.14 of the sample variation in \\( x \\) is explained by the sample regression equation \63.36 of the sample variation in \\( x \\) is explained by the sample regression equatio \35.71 of the sample variation in \\( y \\) is explained by the sample regression equation A research analyst is trying to determine whether a firm's price-earnings (PE) and price-sales (PS) ratios can explain the firm's stock performance over the past year. A PE ratio is calculated as a firm's share price compared to the income or profit earned by the firm per share. Generally, a high PE ratio suggests that investors are expecting higher earnings growth in the future compared to companies with a lower PE ratio. The PS ratio is calculated by dividing a firm's share price by the firm's revenue per share for the trailing 12 months. In short, investors can use the PS ratio to determine how much they are paying for a dollar of the firm's sales rather than a dollar of its earnings (PE ratio). In general, the lower the PS ratio, the more attractive the investment. The accompanying table shows a portion of the year-to-date returns (Return in \\%) and the PE and PS ratios for 30 firms. Click here for the Excel Data File a-1. Estimate: Return \\( =\\beta_{0}+\\beta_{1} \\mathrm{PE}+\\beta_{2} \\mathrm{PS}+\\varepsilon \\). (Negative values should be indicated by a minus sign. Round your answers to 2 decimal places.) Predicted Return \\( = \\) \\( + \\) PE + PS \\begin{tabular}{|c|l|l|l|l|} \\hline & \\multicolumn{2}{|c|}{ A } & \\multicolumn{1}{c|}{ B } & \\multicolumn{1}{c|}{ C } \\\\ \\hline 1 & Firm & Return & PE & PS \\\\ \\hline 2 & 1 & 4.6 & 14.39 & 2.45 \\\\ \\hline 3 & 2 & -4.1 & 11.05 & 0.78 \\\\ \\hline 4 & 3 & 5.9 & 11.97 & 2.23 \\\\ \\hline 5 & 4 & 5 & 11.31 & 1.37 \\\\ \\hline 6 & 5 & -11.6 & 9.84 & 1.85 \\\\ \\hline 7 & 6 & 20.7 & 15.63 & 0.83 \\\\ \\hline 8 & 7 & 64.3 & 16.07 & 1.63 \\\\ \\hline 9 & 8 & 18.7 & 8.97 & 1.02 \\\\ \\hline 10 & 9 & -15.4 & 11.37 & 2.76 \\\\ \\hline 11 & 10 & 48.1 & 13.71 & 1.46 \\\\ \\hline 12 & 11 & 7.1 & 11.49 & 1.21 \\\\ \\hline 13 & 12 & 21.2 & 14.36 & 1.28 \\\\ \\hline 14 & 13 & -18 & 8.21 & 0.79 \\\\ \\hline 15 & 14 & 2.9 & 9.49 & 2.71 \\\\ \\hline 16 & 15 & 12.1 & 11.19 & 2 \\\\ \\hline 17 & 16 & -4.1 & 12.64 & 2.77 \\\\ \\hline 18 & 17 & 2.1 & 9.66 & 2.03 \\\\ \\hline 19 & 18 & 16.1 & 13.49 & 1.12 \\\\ \\hline 20 & 19 & 23.1 & 14.95 & 3.36 \\\\ \\hline 21 & 20 & -1.4 & 8.95 & 2.41 \\\\ \\hline 22 & 21 & -8.2 & 10.57 & 3.68 \\\\ \\hline 23 & 22 & -3.6 & 7.9 & 2.23 \\\\ \\hline 24 & 23 & 15.6 & 16.38 & 4.57 \\\\ \\hline 25 & 24 & 21.4 & 16.29 & 0.91 \\\\ \\hline 26 & 25 & 6.1 & 15.07 & 2.31 \\\\ \\hline 27 & 26 & 11.5 & 9.17 & 1.01 \\\\ \\hline 28 & 27 & 13.6 & 14.95 & 1.39 \\\\ \\hline 29 & 28 & 15.9 & 15.57 & 0.94 \\\\ \\hline 30 & 29 & 0.7 & 12.56 & 0.45 \\\\ \\hline 31 & 30 & 16.3 & 13.93 & 1.92 \\\\ \\hline \\end{tabular} a-2. Are the signs on the coefficients as expected? Yes No b. Interpret the slope coefficient of the PS ratio. As the PS ratio increases by 1 unit, the predicted return of the firm decreases by \3.30, holding PE constant. As the PS ratio increases by 1 unit, the predicted return of the firm increases by \3.30, holding PE constant. As the PS ratio increases by 1 unit, the predicted return of the firm decreases by \33.47, holding PE constant. As the PS ratio decreases by 1 unit, the predicted return of the firm decreases by \33.47, holding PE constant. c. What is the predicted return for a firm with a PE ratio of 10 and a PS ratio of 2? (Negative value should be indicated by a minus sign. Do not round intermediate calculations. Round final answer to 2 decimal places.) d. What is the standard error of the estimate? (Round your answer to 2 decimal places.) e. Interpret \\( R^{2} \\). \40.14 of the sample variation in \\( y \\) is explained by the sample regression equation \40.14 of the sample variation in \\( x \\) is explained by the sample regression equation \63.36 of the sample variation in \\( x \\) is explained by the sample regression equatio \35.71 of the sample variation in \\( y \\) is explained by the sample regression equation A research analyst is trying to determine whether a firm's price-earnings (PE) and price-sales (PS) ratios can explain the firm's stock performance over the past year. A PE ratio is calculated as a firm's share price compared to the income or profit earned by the firm per share. Generally, a high PE ratio suggests that investors are expecting higher earnings growth in the future compared to companies with a lower PE ratio. The PS ratio is calculated by dividing a firm's share price by the firm's revenue per share for the trailing 12 months. In short, investors can use the PS ratio to determine how much they are paying for a dollar of the firm's sales rather than a dollar of its earnings (PE ratio). In general, the lower the PS ratio, the more attractive the investment. The accompanying table shows a portion of the year-to-date returns (Return in \\%) and the PE and PS ratios for 30 firms. Click here for the Excel Data File a-1. Estimate: Return \\( =\\beta_{0}+\\beta_{1} \\mathrm{PE}+\\beta_{2} \\mathrm{PS}+\\varepsilon \\). (Negative values should be indicated by a minus sign. Round your answers to 2 decimal places.) Predicted Return \\( = \\) \\( + \\) PE + PS \\begin{tabular}{|c|l|l|l|l|} \\hline & \\multicolumn{2}{|c|}{ A } & \\multicolumn{1}{c|}{ B } & \\multicolumn{1}{c|}{ C } \\\\ \\hline 1 & Firm & Return & PE & PS \\\\ \\hline 2 & 1 & 4.6 & 14.39 & 2.45 \\\\ \\hline 3 & 2 & -4.1 & 11.05 & 0.78 \\\\ \\hline 4 & 3 & 5.9 & 11.97 & 2.23 \\\\ \\hline 5 & 4 & 5 & 11.31 & 1.37 \\\\ \\hline 6 & 5 & -11.6 & 9.84 & 1.85 \\\\ \\hline 7 & 6 & 20.7 & 15.63 & 0.83 \\\\ \\hline 8 & 7 & 64.3 & 16.07 & 1.63 \\\\ \\hline 9 & 8 & 18.7 & 8.97 & 1.02 \\\\ \\hline 10 & 9 & -15.4 & 11.37 & 2.76 \\\\ \\hline 11 & 10 & 48.1 & 13.71 & 1.46 \\\\ \\hline 12 & 11 & 7.1 & 11.49 & 1.21 \\\\ \\hline 13 & 12 & 21.2 & 14.36 & 1.28 \\\\ \\hline 14 & 13 & -18 & 8.21 & 0.79 \\\\ \\hline 15 & 14 & 2.9 & 9.49 & 2.71 \\\\ \\hline 16 & 15 & 12.1 & 11.19 & 2 \\\\ \\hline 17 & 16 & -4.1 & 12.64 & 2.77 \\\\ \\hline 18 & 17 & 2.1 & 9.66 & 2.03 \\\\ \\hline 19 & 18 & 16.1 & 13.49 & 1.12 \\\\ \\hline 20 & 19 & 23.1 & 14.95 & 3.36 \\\\ \\hline 21 & 20 & -1.4 & 8.95 & 2.41 \\\\ \\hline 22 & 21 & -8.2 & 10.57 & 3.68 \\\\ \\hline 23 & 22 & -3.6 & 7.9 & 2.23 \\\\ \\hline 24 & 23 & 15.6 & 16.38 & 4.57 \\\\ \\hline 25 & 24 & 21.4 & 16.29 & 0.91 \\\\ \\hline 26 & 25 & 6.1 & 15.07 & 2.31 \\\\ \\hline 27 & 26 & 11.5 & 9.17 & 1.01 \\\\ \\hline 28 & 27 & 13.6 & 14.95 & 1.39 \\\\ \\hline 29 & 28 & 15.9 & 15.57 & 0.94 \\\\ \\hline 30 & 29 & 0.7 & 12.56 & 0.45 \\\\ \\hline 31 & 30 & 16.3 & 13.93 & 1.92 \\\\ \\hline \\end{tabular} a-2. Are the signs on the coefficients as expected? Yes No b. Interpret the slope coefficient of the PS ratio. As the PS ratio increases by 1 unit, the predicted return of the firm decreases by \3.30, holding PE constant. As the PS ratio increases by 1 unit, the predicted return of the firm increases by \3.30, holding PE constant. As the PS ratio increases by 1 unit, the predicted return of the firm decreases by \33.47, holding PE constant. As the PS ratio decreases by 1 unit, the predicted return of the firm decreases by \33.47, holding PE constant. c. What is the predicted return for a firm with a PE ratio of 10 and a PS ratio of 2? (Negative value should be indicated by a minus sign. Do not round intermediate calculations. Round final answer to 2 decimal places.)
Step by Step Solution
There are 3 Steps involved in it

Get step-by-step solutions from verified subject matter experts