Please show work and show answers. This is due soon and start at question 1.
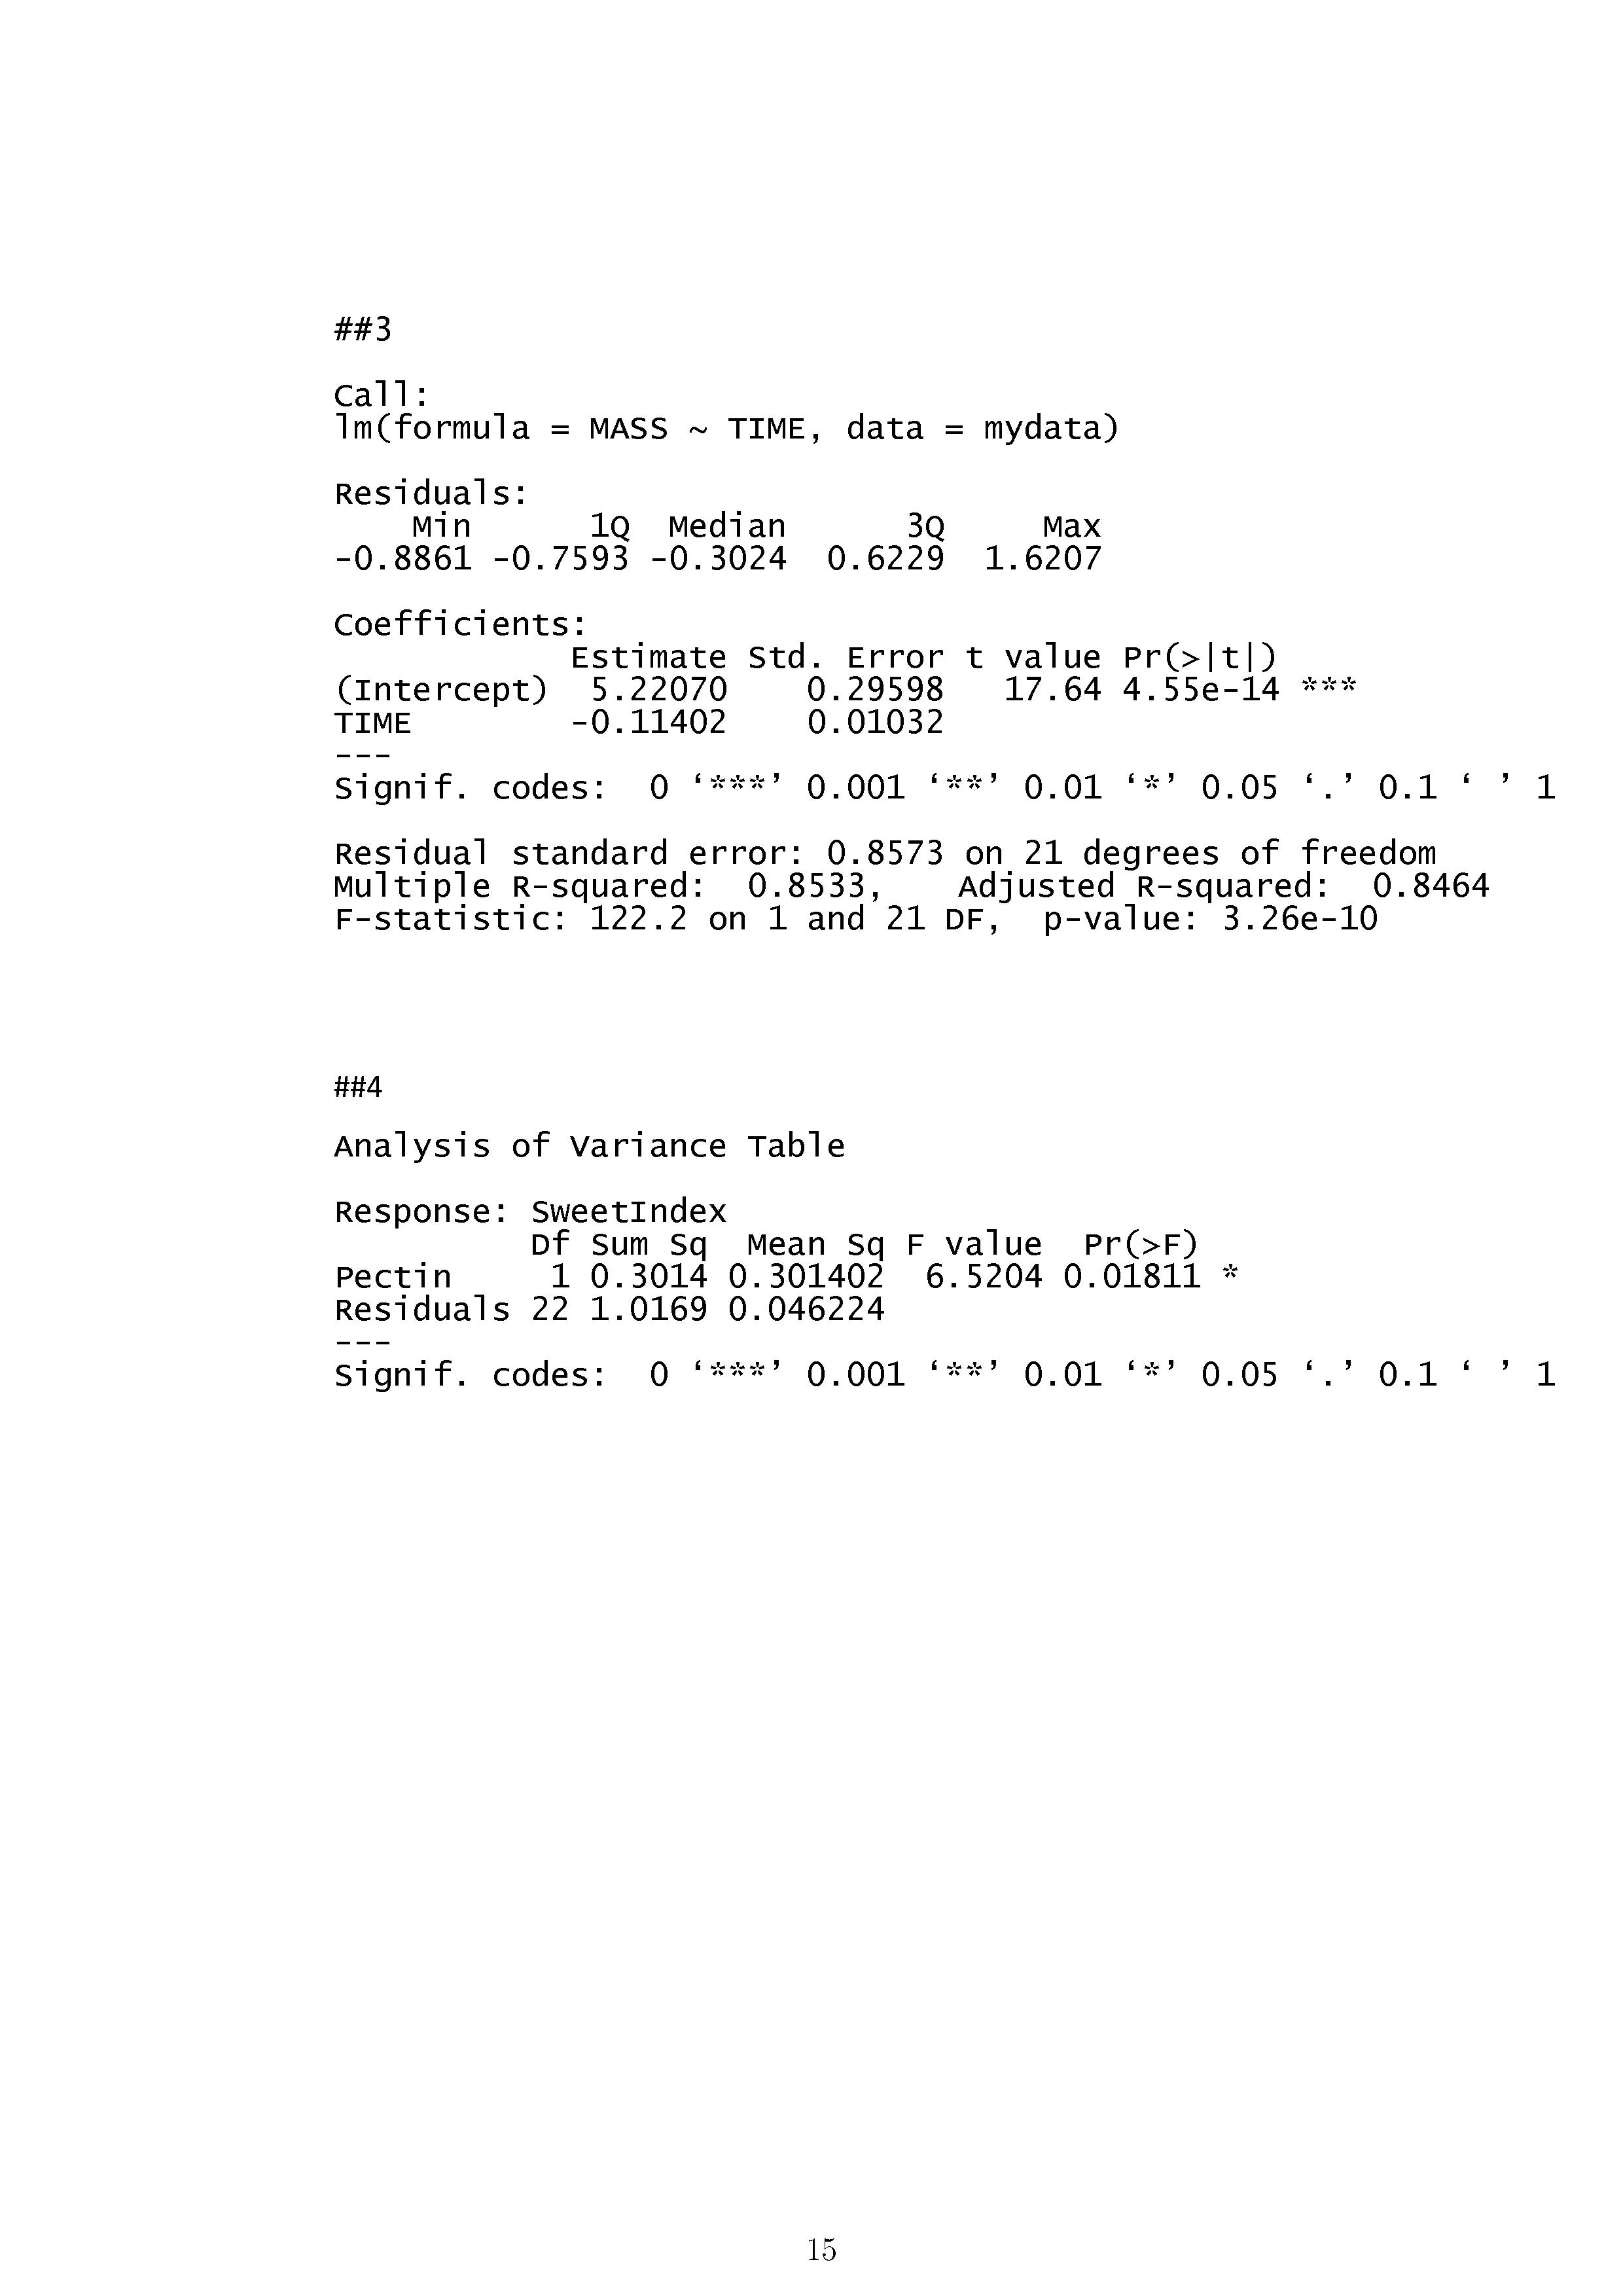
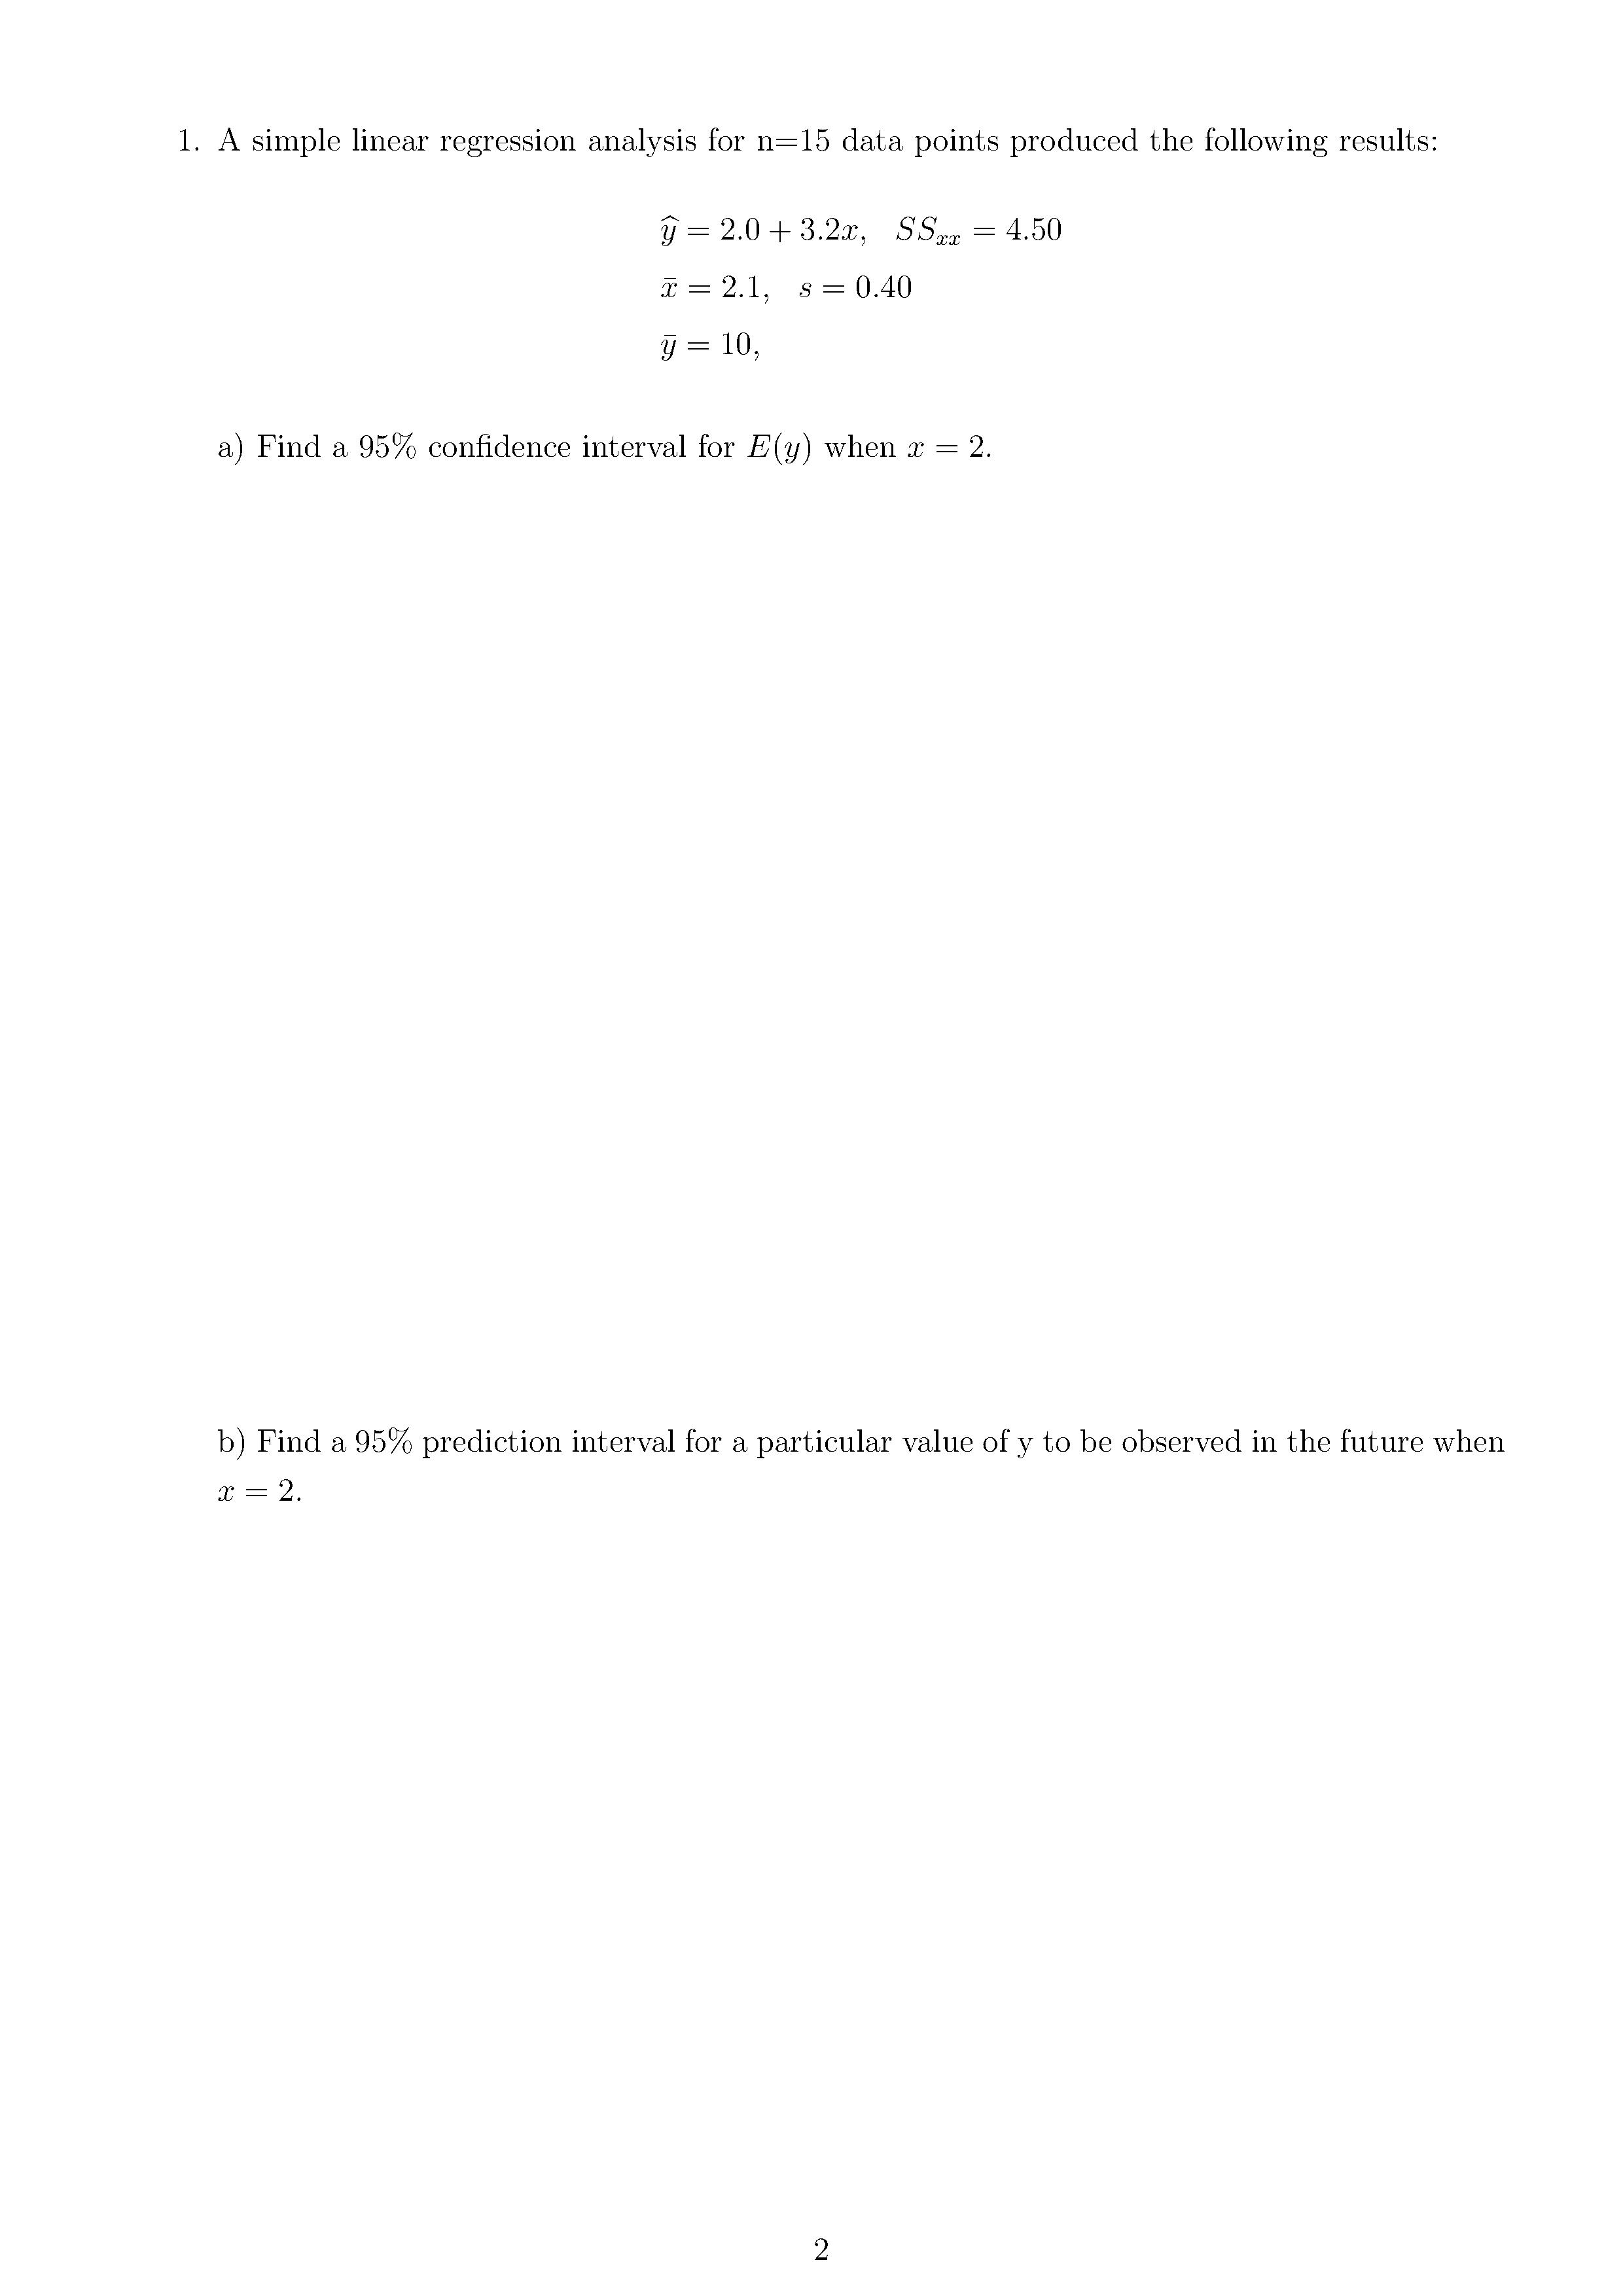
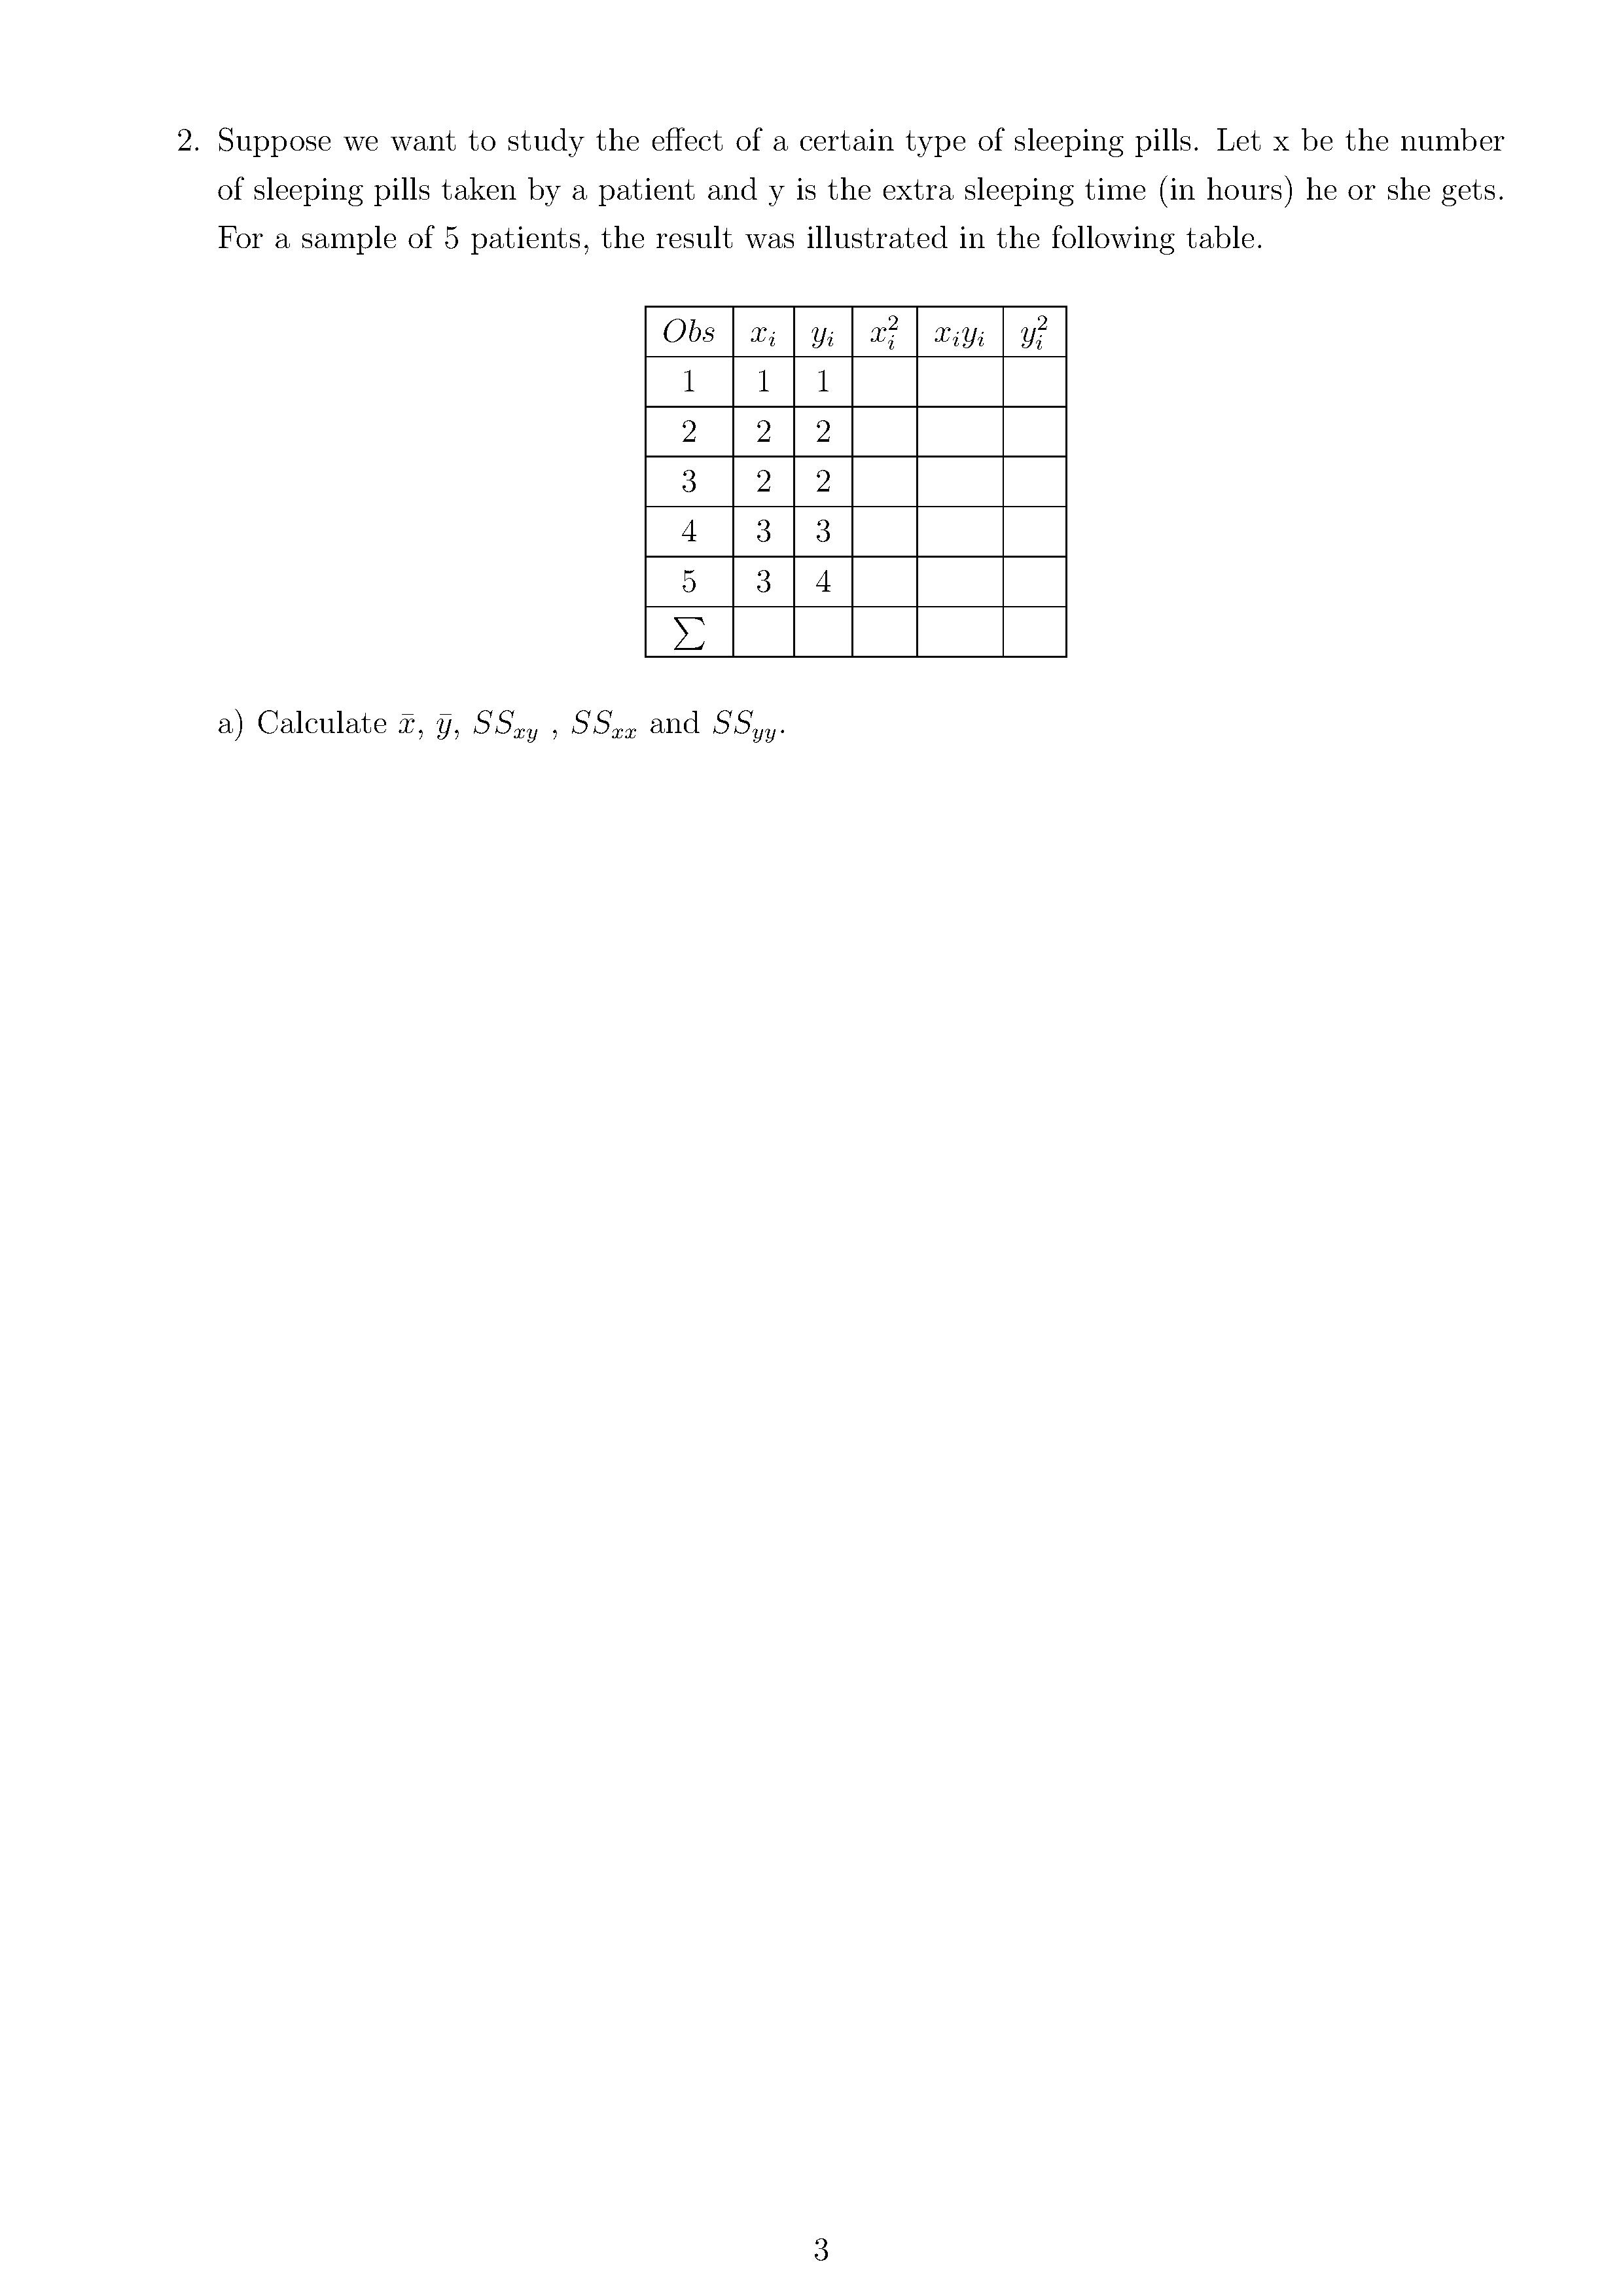
g) Construct a, 96% prediction interval for the the mass of a, single spill With an (Elapsed time of 15 minutes. Given that a? = 22.87, 71 = 237 SS\" 2 6906.609. 10 h) Conduct a test to determine if there is sufficient evidence (at a = 0.05) to indicate that the spill mass (y) is linearly related with time (x)? i) List the assumptions about e required for the linear regression. 114. The quality of the orange juice produced by a manufar:turer (0g, Minute Maid, Tropicana) is constantly monitored There are numerous sensory and chemical components that combine to make the best tasting orange juice. For example. one manufacturer has developed a quantitative index of the sweetness of orange juice. (The higher the index7 the sweeter the juice.) Is there a relationship between the sweetness index and a chemical measure such as the amount of water-soluble pectin (parts per million) in the orange juice? Data collected on these two variables for 24 production runs at a juice manufacturing plant are in the OJUICE.txt data. A straight line model to predict the sweetness (y) from the amount of pectin (x) is t to the data using R and ANOVA of the model is given below. Find the value of coeicient of determination R2 and provide an interpretation. 5. Write the four basic assumptions about the general form of the probability distribution of e in linear regression. l2 6. According to Facebook.com, the mean number of community pages, groups, and events that users are connected to is 80. A random sample of 64 Facebook users showed a mean of 86 connections to community pages, groups, and events. Assume that o =48. Test using level of significance a = 0.05 whether the population mean number of connections to community pages, groups, and events is greater than 80. 137. A softdrink machine is regulated so that it discharges an average of 200 milliliters per cup. If the amount of drink is normally distributed with a standard deviation equal to 15 milliliters, a)VVhat is the probability that a cup contains between 191 and 209 milliliters? b) What is the probability that a randomly chosen cup contains at least 209 milliliters? c) What is the probability that a randomly selected cup contains at most 191 milliliters? d) Below what value do we get the smallest 25 % of the drink? 14 ##3 Call : 1m (formula = MASS ~ TIME, data = mydata) Residuals : Min 1Q Median -0. 8861 -0. 7593 -0. 3024 3Q 0. 6229 Max 1. 6207 Coefficients: (Intercept) Estimate Std. Error t value Pr(>|t|) 5. 22070 0 . 29598 17. 64 4.55e-14 * * * TIME -0. 11402 0. 01032 Signif. codes: 0.001 '' 0.01 '' 0.05 '.' 0.1 '' Residual standard error: 0. 8573 on 21 degrees of freedom Multiple R-squared: 0.8533, Adjusted R-squared: 0. 8464 F-statistic: 122.2 on 1 and 21 DF, p-value: 3.26e-10 ##4 Analysis of Variance Table Response: SweetIndex Df Sum Sq Mean Sq F value Pr(>F) Pectin 1 0. 3014 0. 301402 6. 5204 0. 01811 Residuals 22 1. 0169 0. 046224 Signif. codes: 0 '' 0.001 '' 0.01 '' 0.05 '.' 0.1 ' ' 1 151. A simple linear regression analysis for n=15 data points produced the following results: y = 2.0 + 3.2x, SSxx = 4.50 x = 2.1, s = 0.40 y = 10, a) Find a 95% confidence interval for E(y) when x = 2. b) Find a 95% prediction interval for a particular value of y to be observed in the future when x = 2. NO2. Suppose we want to study the effect of a certain type of sleeping pills. Let x be the number of sleeping pills taken by a patient and y is the extra sleeping time (in hours) he or she gets. For a sample of 5 patients, the result was illustrated in the following table. a) Calculate :75, 3/7 SSW , SSm and 53%. h) Find the least squares Estimate of 50 and 31 and hence write the estimated equation of the regression line. c) What is the estimated standard error of the regression model 5 ? Interpret its value. d) Compute the standard error of ,9: e) Construct and Interpret a 90% confidence interval for B1. f) Calculate the coefficient of determination R2? interpret it. g) Find the coefficient of variation. 5\fi) Write the equation of least squares regression line and draw its graph. For fourth observa- tion, compute the predicted value y4, the residual e4, and label these values on the graph.3. A contract engineer at DuPont Corp. studied the rate at which a spilled volatile liquid will spread across a surface. Assume 50 gallons of methanol spills onto a level surface outdoors. The engineer used derived empirical formulas (assuming a state of turbulent free convection) to calculate the mass (in pounds) of the spill after a period of time ranging from 0 to 60 minutes. a) Propose a straight-line model relating mass of the spill (y) to elapsed time of the spill(x). The model, part a, was t to the data using R as shown in the accompanying printout.Use the summary of R printout to answer the following questions b) Write the least squares prediction equation. c) Interpret the meaning of B; in the context of the problem. d) Write the estimated standard error of the regression model7s and interpret it. (3) Write the value of H2 in the model and provide an interpretation of this value. f) Construct a 95% condence interval for the mean mass of all spills E (y) with an elapsed time of 15 minutes. Given that :7: = 22.877 11, = '237 SSm = 69066094