

Question
Please show how to finish this problem in matlab. Code for adams bash 2 is provided below! -------------- ---------------- AB2 Code: Nmagnitude=15; Nangle=31; unmap=1; animate=1;
Please show how to finish this problem in matlab. Code for adams bash 2 is provided below!
--------------
----------------
AB2 Code:
Nmagnitude=15; Nangle=31; unmap=1; animate=1;
zcp=sqrt(3)/3;
junk=linspace(-pi,pi,Nangle+1); theta=junk(2:length(junk)); r=linspace(1,zcp,Nmagnitude);
t=linspace(-pi,pi,10001); rho=linspace(1,zcp,1001);
if(unmap==1) %Prepare figure(2) figure(2) clf hold on for k=1:length(r) z=r(k)*exp(i*t); plot(real(z),imag(z)) if(animate==1) pause(0.5) end end
for k=1:length(theta) z=rho*exp(i*theta(k)); plot(real(z),imag(z)) if(animate==1) pause(0.5) end end hold off end
figure(1) clf
hold on
for k=1:length(r) z=r(k)*exp(i*t); w=2*(z.^2-z)./(3*z-1); plot(real(w),imag(w)) if(animate==1) pause(0.5) end end
for k=1:length(theta) z=rho*exp(i*theta(k)); w=2*(z.^2-z)./(3*z-1); plot(real(w),imag(w)) if(animate==1) pause(0.5) end end hold off
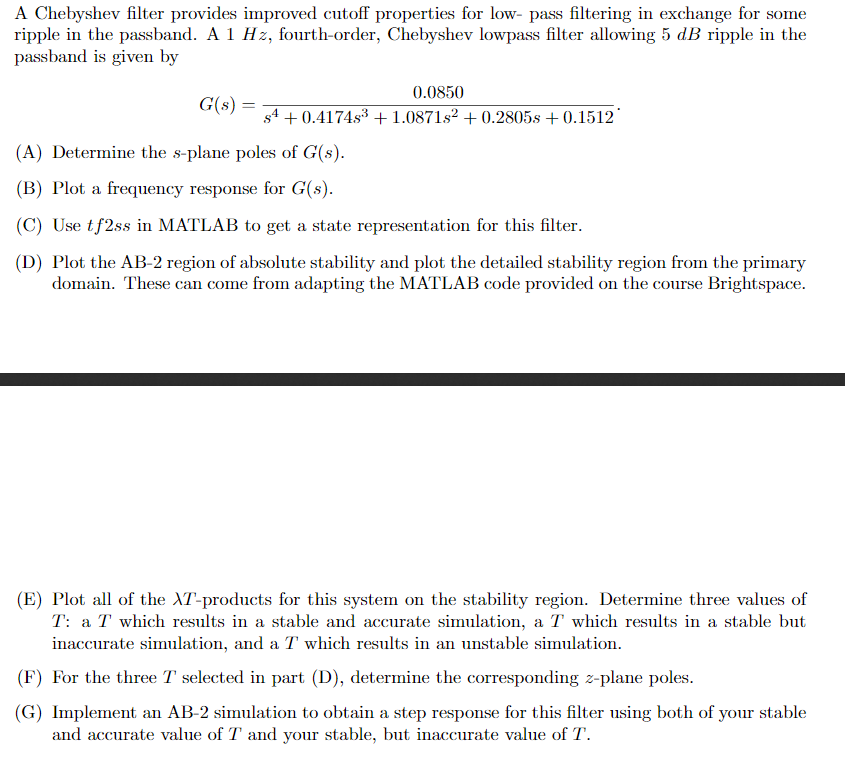
A Chebyshev filter provides improved cutoff properties for low-pass filtering in exchange for some ripple in the passband. A 1 Hz, fourth-order, Chebyshev lowpass filter allowing 5 dB ripple in the passband is given by 0.0850 S4 +0.4174s3 + 1.087152 +0.2805s + 0.1512 (A) Determine the s-plane poles of G(s). (B) Plot a frequency response for G(s). (C) Use tf2ss in MATLAB to get a state representation for this filter. (D) Plot the AB-2 region of absolute stability and plot the detailed stability region from the primary domain. These can come from adapting the MATLAB code provided on the course Brightspace. (E) Plot all of the XT-products for this system on the stability region. Determine three values of T: a T which results in a stable and accurate simulation, a T which results in a stable but inaccurate simulation, and a T which results in an unstable simulation. (F) For the three T selected in part (D), determine the corresponding z-plane poles. (G) Implement an AB-2 simulation to obtain a step response for this filter using both of your stable and accurate value of T and your stable, but inaccurate value of T. A Chebyshev filter provides improved cutoff properties for low-pass filtering in exchange for some ripple in the passband. A 1 Hz, fourth-order, Chebyshev lowpass filter allowing 5 dB ripple in the passband is given by 0.0850 S4 +0.4174s3 + 1.087152 +0.2805s + 0.1512 (A) Determine the s-plane poles of G(s). (B) Plot a frequency response for G(s). (C) Use tf2ss in MATLAB to get a state representation for this filter. (D) Plot the AB-2 region of absolute stability and plot the detailed stability region from the primary domain. These can come from adapting the MATLAB code provided on the course Brightspace. (E) Plot all of the XT-products for this system on the stability region. Determine three values of T: a T which results in a stable and accurate simulation, a T which results in a stable but inaccurate simulation, and a T which results in an unstable simulation. (F) For the three T selected in part (D), determine the corresponding z-plane poles. (G) Implement an AB-2 simulation to obtain a step response for this filter using both of your stable and accurate value of T and your stable, but inaccurate value of TStep by Step Solution
There are 3 Steps involved in it
Step: 1

Get Instant Access to Expert-Tailored Solutions
See step-by-step solutions with expert insights and AI powered tools for academic success
Step: 2

Step: 3
Ace Your Homework with AI
Get the answers you need in no time with our AI-driven, step-by-step assistance
Get Started
Database And Expert Systems Applications 33rd International Conference Dexa 2022 Vienna Austria August 22 24 2022 Proceedings Part 2 Lncs 13427
Authors: Christine Strauss ,Alfredo Cuzzocrea ,Gabriele Kotsis ,A Min Tjoa ,Ismail Khalil
1st Edition
3031124251, 978-3031124259