Please show how to solve for Earnings per share in 2017 and 2016. And how to find Reurn on Common Stockholders Equity, Debt to Assets Ratio, and Price Earnings Ratio for 2018 and 2017.
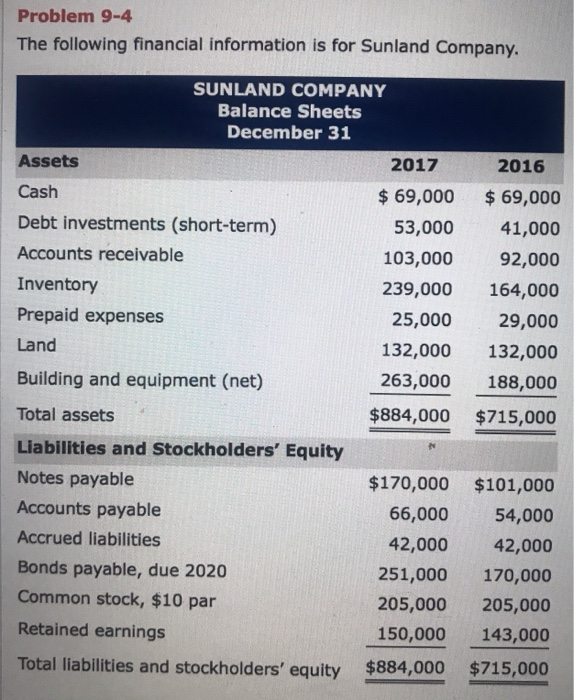
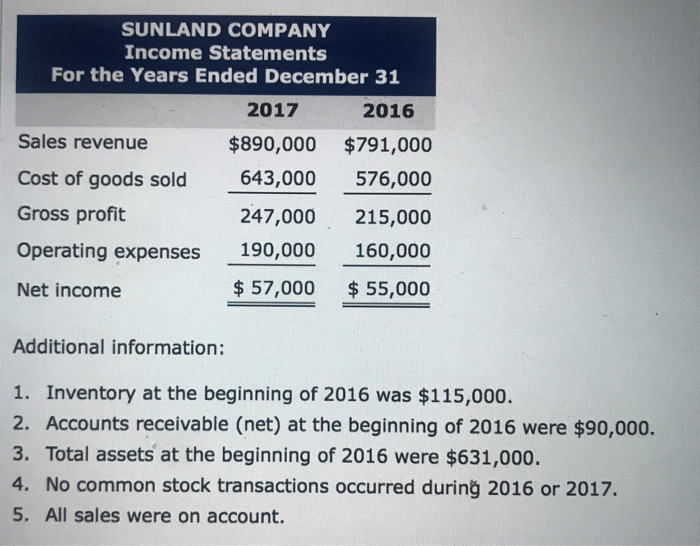
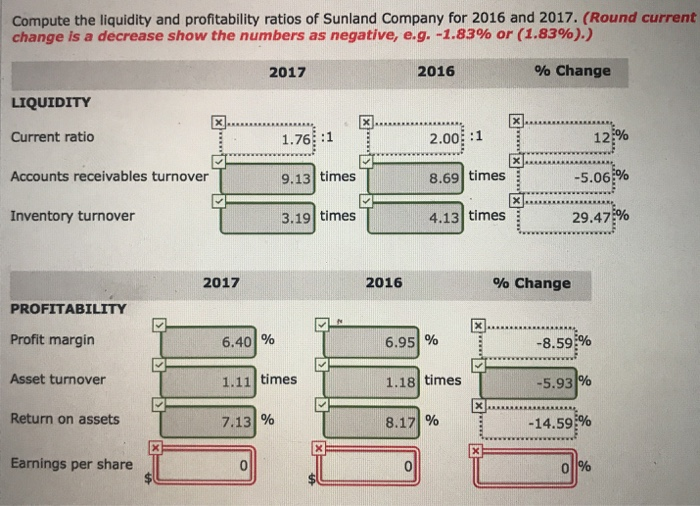
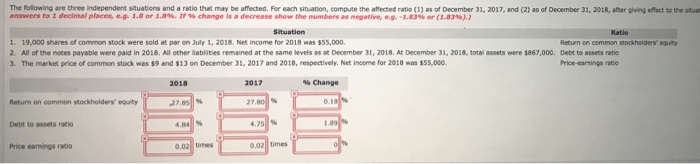
Problem 9-4 The following financial information is for Sunland Company. SUNLAND COMPANY Balance Sheets December 31 Assets 2017 Cash $ 69,000 Debt investments (short-term) 53,000 Accounts receivable 103,000 Inventory 239,000 Prepaid expenses 25,000 Land 132,000 Building and equipment (net) 263,000 Total assets $884,000 Liabilities and Stockholders' Equity Notes payable $170,000 Accounts payable 66,000 Accrued liabilities 42,000 Bonds payable, due 2020 251,000 Common stock, $10 par 205,000 Retained earnings 150,000 Total liabilities and stockholders' equity $884,000 2016 $ 69,000 41,000 92,000 164,000 29,000 132,000 188,000 $715,000 $101,000 54,000 42,000 170,000 205,000 143,000 $715,000 SUNLAND COMPANY Income Statements For the Years Ended December 31 2017 2016 Sales revenue $890,000 $791,000 Cost of goods sold 643,000 576,000 Gross profit 247,000 215,000 Operating expenses 190,000 160,000 Net income $ 57,000 $ 55,000 Additional information: 1. Inventory at the beginning of 2016 was $115,000. 2. Accounts receivable (net) at the beginning of 2016 were $90,000. 3. Total assets at the beginning of 2016 were $631,000. 4. No common stock transactions occurred during 2016 or 2017. 5. All sales were on account. Compute the liquidity and profitability ratios of Sunland Company for 2016 and 2017. (Round current change is a decrease show the numbers as negative, e.g. -1.83% or (1.83%).) 2017 2016 % Change LIQUIDITY Current ratio 2.000:1 Accounts receivables turnover T 9.13 times 8.69 times -5.06% Inventory turnover 3.19 times 4.13 times 29.47% 2017 2016 % Change PROFITABILITY X... Profit margin 6.40% 6.951 6.95% -8.59% Asset turnover 1.11 times 1.18 -5.93% Return on assets 7.13 % 8.17 % -14.59% Earnings per share The following are three independent situations and a ratio that may be affected. For each situation, compute the affected ratio (1) as of December 31, 2017, and (2) as of December 31, 2018, after giving effect to the star answers to 1 decimal places, e.g. 1.8 or 1.8 . change is a decrease show the numbers as negative, e.g.-1.83% or (1.8 ).) Ratio 1. 19,000 shares of common stock were sold at par on July 1, 2018. Net Income for 2018 was $55,000 Return on common stockholders' equity 2. All of the noces payable were paid in 2018. All other abilities remained at the same levels as a December 31, 2018. At December 31, 2018, total assets were $867,000. Debit to assets ratio 3. The market price of common stock was $9 and $13 on December 31, 2017 and 2018, respectively. Net Income for 2018 was $55.000 Price-earnings at 2018 2017 Change Return on common stockholders' equity T 27.85 Debt to assets ratio Price camins ratio times 0,02