

Answered step by step
Verified Expert Solution
Question
1 Approved Answer
Please show how work is done in excel. Thank you See Table 2.5 E showing financial statement data and stock price data for Mydeco Corp.
Please show how work is done in excel. Thank you
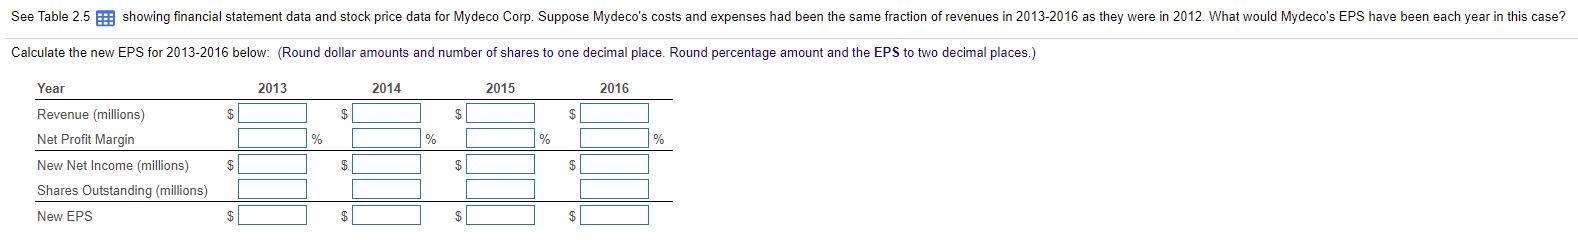
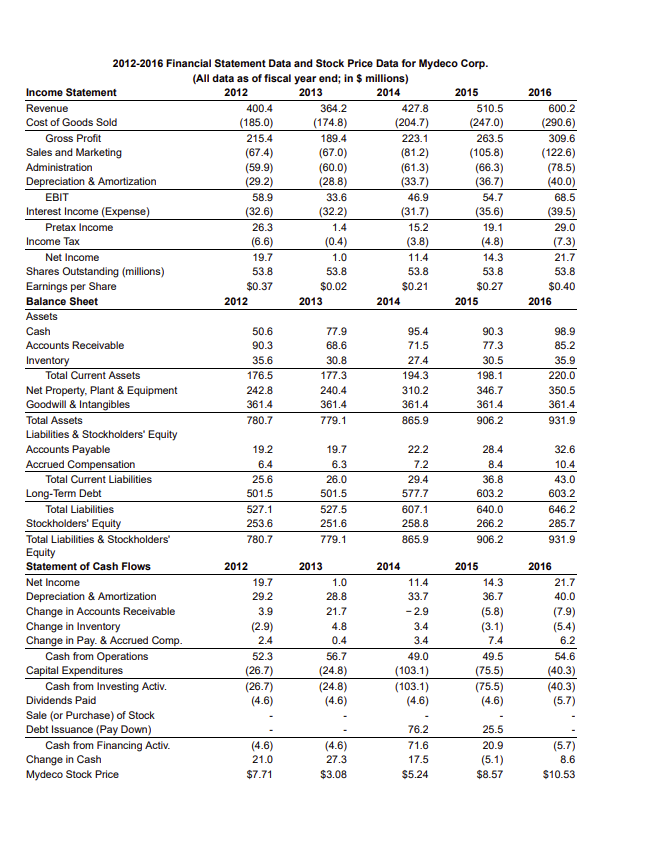
See Table 2.5 E showing financial statement data and stock price data for Mydeco Corp. Suppose Mydeco's costs and expenses had been the same fraction of revenues in 2013-2016 as they were in 2012. What would Mydeco's EPS have been each year in this case? Calculate the new EPS for 2013-2016 below: (Round dollar amounts and number of shares to one decimal place. Round percentage amount and the EPS to two decimal places.) Year 2013 2014 2015 2016 $ $ % % % Revenue (millions) Net Profit Margin New Net Income (millions) Shares Outstanding (millions) New EPS $ $ $ $ $ $ $ $ 2016 600.2 (290.6) 309.6 (122.6) (78.5) (40.0) 68.5 (39.5) 29.0 (7.3) 21.7 53.8 $0.40 2016 2012-2016 Financial Statement Data and Stock Price Data for Mydeco Corp. (All data as of fiscal year end; in $ millions) Income Statement 2012 2013 2014 2015 Revenue 400.4 364.2 427.8 510.5 Cost of Goods Sold (185.0) (174.8) (204.7) (247.0) Gross Profit 215.4 189.4 223.1 263.5 Sales and Marketing (67.4) (67.0) (81.2) (105.8) Administration (59.9) (60.0) (61.3) (66.3) Depreciation & Amortization (29.2) (28.8) (33.7) (36.7) EBIT 58.9 33.6 46.9 54.7 Interest Income (Expense) (32.6) (32.2) (31.7) (35.6) Pretax Income 26.3 1.4 15.2 19.1 Income Tax (6.6) (0.4) (3.8) (4.8) Net Income 19.7 1.0 11.4 14.3 Shares Outstanding (millions) 53.8 53.8 53.8 53.8 Earnings per Share $0.37 $0.02 $0.21 $0.27 Balance Sheet 2012 2013 2014 2015 Assets Cash 50.6 77.9 95.4 90.3 Accounts Receivable 90.3 68.6 71.5 77.3 Inventory 35.6 30.8 27.4 30.5 Total Current Assets 176.5 177.3 194.3 198.1 Net Property, Plant & Equipment 242.8 240.4 310.2 346.7 Goodwill & Intangibles 361.4 361.4 361.4 361.4 Total Assets 780.7 779.1 865.9 906.2 Liabilities & Stockholders' Equity Accounts Payable 19.2 19.7 22.2 28.4 Accrued Compensation 6.3 7.2 8.4 Total Current Liabilities 25.6 26.0 29.4 36.8 Long-Term Debt 501.5 501.5 577.7 603.2 Total Liabilities 527.1 527.5 607.1 640.0 Stockholders' Equity 253.6 251.6 258.8 266.2 Total Liabilities & Stockholders' 780.7 779.1 865.9 906.2 Equity Statement of Cash Flows 2012 2013 2014 2015 Net Income 19.7 1.0 11.4 14.3 Depreciation & Amortization 29.2 28.8 33.7 36.7 Change in Accounts Receivable 3.9 21.7 -2.9 (5.8) Change in Inventory (2.9) 4.8 3.4 (3.1) Change in Pay. & Accrued Comp. 2.4 0.4 3.4 7.4 Cash from Operations 52.3 56.7 49.0 49.5 Capital Expenditures (26.7) (24.8) (103.1) (75.5) Cash from Investing Activ. (26.7) (24.8) (103.1) (75.5) Dividends Paid (4.6) (4.6) (4.6) (4.6) Sale (or Purchase) of Stock Debt Issuance (Pay Down) 76.2 25.5 Cash from Financing Activ. (4.6) 71.6 20.9 Change in Cash 21.0 27.3 17.5 (5.1) Mydeco Stock Price $7.71 $3.08 $5.24 $8.57 98.9 85.2 35.9 220.0 350.5 361.4 931.9 6.4 32.6 10.4 43.0 603.2 646.2 285.7 931.9 2016 21.7 40.0 (7.9) (5.4) 6.2 54.6 (40.3) (40.3) (5.7) (4.6) (5.7) 8.6 $10.53Step by Step Solution
There are 3 Steps involved in it
Step: 1

Get Instant Access to Expert-Tailored Solutions
See step-by-step solutions with expert insights and AI powered tools for academic success
Step: 2

Step: 3
Ace Your Homework with AI
Get the answers you need in no time with our AI-driven, step-by-step assistance
Get Started
Financial Markets and Institutions
Authors: Frederic S. Mishkin, Stanley G. Eakins
5th edition