Answered step by step
Verified Expert Solution
Question
1 Approved Answer
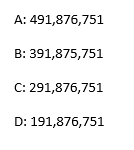
Please show how you calculate. Consolidated Statements of Income 3 Months Ended 12 Months Ended (USD In Millions, except Per Share data, Jan. 31, 2015
Please show how you calculate.
Consolidated Statements of Income 3 Months Ended 12 Months Ended (USD In Millions, except Per Share data, Jan. 31, 2015 Nov. 01, 2014 Aug. 02, 2014 May 03, 2014 Feb. 01, 2014 Nov. 02, 2013 Aug. 03, 2013 May 04, 2013 Feb. 02, 2013 Jan. 31, 2015 Feb. 01, 2014 Feb. 02, 2013 unless otherwise specified 11,454 10,773 Net Sales 4,069 2,319 2,675 $2,39 3,818 $2,17 2,516 $2,268 10,459 Costs of Goods Sold, Buying and 6,646 6,344 6,073 Occupancy 1.835 4.429 4.386 4,808 Gross Profit 947 642 857 General, Administrative and Store 2,855 2,686 2,720 Operating Expenses Impairment of Goodwill and Other Intangible Assets 743 573 Operating Income 957 284 376 336 863 358 953 nterest Expense 324 314 316 Other Income 24 296 1787 142 1282 2035 Income Before Income Taxes 636 1,446 28 Provision for Income Taxes 594 543 528 Net Income 565 132 188 157 490 92 178 143 1,042 903 753 1.93 Pl $0.45 Pl $0.65 $0.54 RU 1.69 $0.32 l2 $0.62 RU $0.49 Pl Net Income Per Basic Share $3.57 3.12 $2.60 is 2.54 1.89 /2) $0.44 21 $0.63 21 $0.53 1.65 21 0.31 RN 0.61 $0.48 21 $3.50 $3.05 Net Income Per Diluted Share [1] Assets are allocated to the operating segments based on decision making authority relevant to the applicable assets [2] Due to changes in stock prices during the year and timing of issuances and repurchases of shares, the cumulative total of quarterly net income per share amounts may not equal the net income per share for the yearStep by Step Solution
There are 3 Steps involved in it
Step: 1
Get Instant Access to Expert-Tailored Solutions
See step-by-step solutions with expert insights and AI powered tools for academic success
Step: 2
Step: 3
Ace Your Homework with AI
Get the answers you need in no time with our AI-driven, step-by-step assistance
Get Started