Answered step by step
Verified Expert Solution
Link Copied!

Question

1 Approved Answer

Please show in excel with formulas In your position as research assistant to a portfolio manager, you need to analyze the profitability of the companies

Please show in excel with formulas image text in transcribed
In your position as research assistant to a portfolio manager, you need to analyze the profitability of the companies in the portfolio. Using the data for 3M Co. below: 2. 2013 2012 2011 2010 2009 Fiscal Year Total Revenue 30,871 29,904 29,611 26,662 23,123 Net Income 4,659 4,444 4,283 4,085 3,193 a. Calculate the net profit margin for each yean b. Calculate the average annual growth rates for revenue and net income using the GEOMEAN function. Is net income growing more slowly or faster than total revenue? Is this a positive for your investment in the company? Calculate the average annual growth rate of total revenue using the AVERAGE function. Is this result more or less accurate than your result in the previous question? Why? Create a Column chart of total revenue and net income. Be sure to c. d. change the chart so that the x-axis labels contain the year numbers, and format the axis so that 2013 is on the far right side of the axis

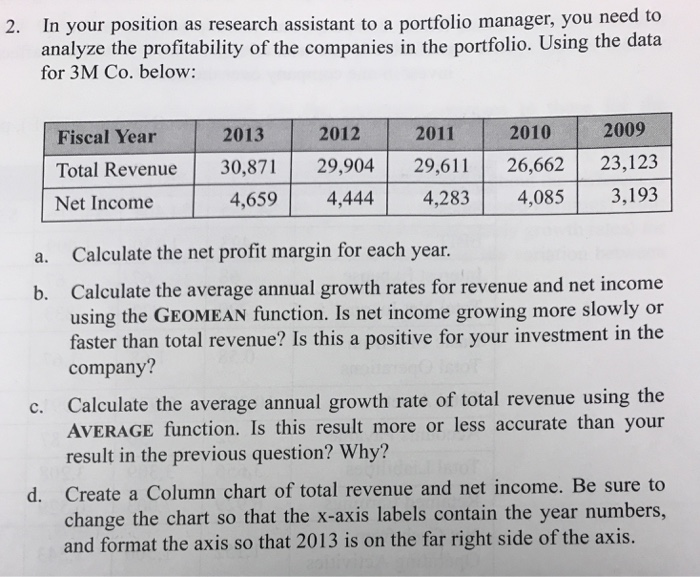
Step by Step Solution

There are 3 Steps involved in it

Step: 1

blur-text-image

Get Instant Access to Expert-Tailored Solutions

See step-by-step solutions with expert insights and AI powered tools for academic success

Step: 2

blur-text-image

Step: 3

blur-text-image

Ace Your Homework with AI

Get the answers you need in no time with our AI-driven, step-by-step assistance

Get Started

Recommended Textbook for

Machine Learning In Finance From Theory To Practice

Authors: Matthew F Dixon, Igor Halperin, Paul Bilokon

1st Edition

3030410676, 978-3030410674

More Books

Students also viewed these Finance questions

Question

3. What is the value of a vision and a mission statement?

Answered: 1 week ago