Answered step by step
Verified Expert Solution
Question
1 Approved Answer
Please show me the formula used in Excel. I just need to see the formula that used in here. League NFL NFL NFL NFL NFL


Please show me the formula used in Excel. I just need to see the formula that used in here.
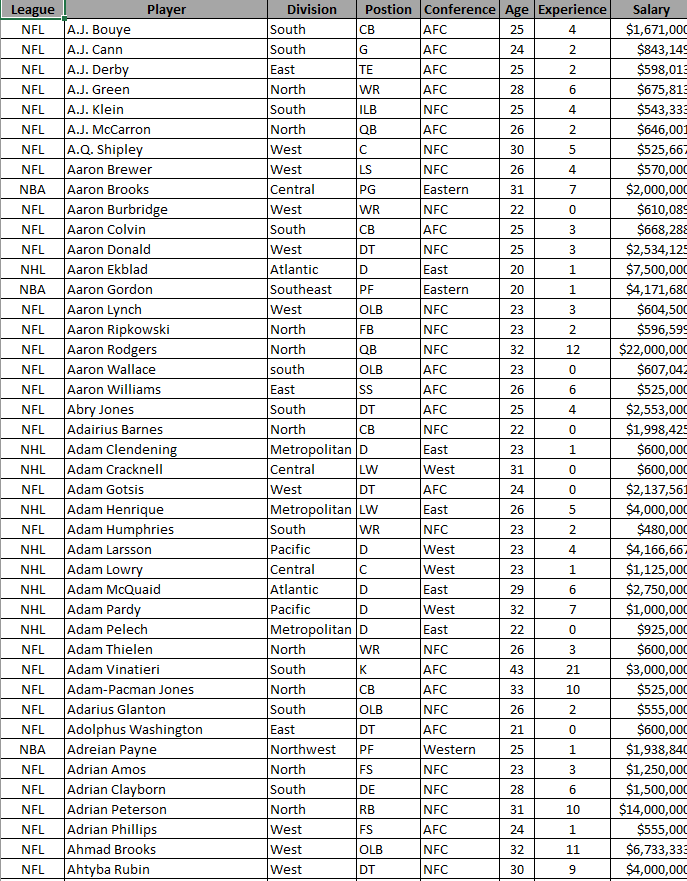
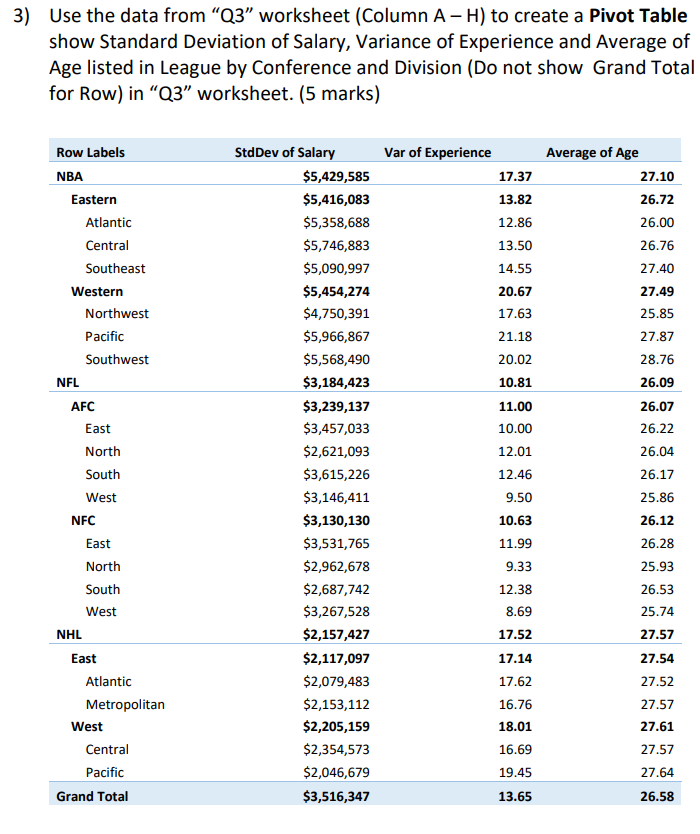
League NFL NFL NFL NFL NFL NFL NFL NFL NBA NFL NFL NFL NHL NBA NFL NFL NFL NFL NFL NFL NFL Player A.J. Bouye A.J. Cann A.J. Derby A.J. Green A.J. Klein A.J. McCarron A.Q. Shipley Aaron Brewer Aaron Brooks Aaron Burbridge Aaron Colvin Aaron Donald Aaron Ekblad Aaron Gordon Aaron Lynch Aaron Ripkowski Aaron Rodgers Aaron Wallace Aaron Williams Abry Jones Adairius Barnes Adam Clendening Adam Cracknell Adam Gotsis Adam Henrique Adam Humphries Adam Larsson Adam Lowry Adam McQuaid Adam Pardy Adam Pelech Adam Thielen Adam Vinatieri Adam-Pacman Jones Adarius Glanton Adolphus Washington Adreian Payne Adrian Amos Adrian Clayborn Adrian Peterson Adrian Phillips Ahmad Brooks Ahtyba Rubin Division Postion Conference Age Experience Salary South CB AFC 25 4 $1,671,000 South G AFC 24 2 $843,149 East TE AFC 25 2 $598,013 North WR AFC 28 6 $675,815 South ILB NFC 25 4 $543,333 North QB AFC 26 2 $646,001 West C NFC 30 5 $525,66 West LS NFC 26 4 $570,000 Central PG Eastern 31 7 $2,000,000 West WR NFC 22 0 $610,089 South CB AFC 25 3 $668,288 West DT NFC 25 3 $2,534,129 Atlantic D East 20 1 $7,500,000 Southeast PF Eastern 20 1 $4,171,680 West OLB NFC 23 3 $604,500 North FB NFC 23 2 $596,599 North QB NFC 32 12 $22,000,000 south OLB AFC 23 0 $607,042 East SS AFC 26 6 $525,000 South DT AFC 25 4 $2,553,000 North CB NFC 22 $1,998,429 Metropolitan D East 23 1 $600,000 Central LW West 31 $600,000 West DT AFC 24 0 $2,137,561 Metropolitan LW East 26 5 $4,000,000 South WR NFC 23 2 $480,000 Pacific D West 23 4 $4,166,667 Central C West 23 1 $1,125,000 Atlantic D East 29 6 $2,750,000 Pacific D West 32 7 $1,000,000 Metropolitan D East 22 0 $925,000 North WR NFC 26 3 $600,000 South | AFC 43 21 $3,000,000 North CB AFC 33 10 $525,000 South OLB NFC 26 2 $555,000 East DT AFC 21 0 $600,000 Northwest PF Western 25 1 $1,938,840 North FS NFC 23 3 $1,250,000 South DE NFC 28 6 $1,500,000 North RB NFC 31 $14,000,000 West FS AFC 24 1 $555,000 West OLB NFC 32 11 $6,733,33% West DT NFC 30 9 $4,000,000 NHL NHL OOON NFL NHL NFL NHL NHL NHL NHL NHL NFL NFL NFL NFL NFL NBA NFL NFL NFL NFL NFL 9 lo NFL 3) Use the data from Q3 worksheet (Column A-H) to create a Pivot Table show Standard Deviation of Salary, Variance of Experience and Average of Age listed in League by Conference and Division (Do not show Grand Total for Row) in "Q3" worksheet. (5 marks) Var of Experience Average of Age 27.10 26.72 26.00 26.76 27.40 27.49 25.85 27.87 28.76 26.09 26.07 26.22 26.04 Row Labels NBA Eastern Atlantic Central Southeast Western Northwest Pacific Southwest NFL AFC East North South West NFC East North South West NHL East Atlantic Metropolitan West Central Pacific Grand Total StdDev of Salary $5,429,585 $5,416,083 $5,358,688 $5,746,883 $5,090,997 $5,454,274 $4,750,391 $5,966,867 $5,568,490 $3,184,423 $3,239,137 $3,457,033 $2,621,093 $3,615,226 $3,146,411 $3,130,130 $3,531,765 $2,962,678 $2,687,742 $3,267,528 $2,157,427 $2,117,097 $2,079,483 $2,153,112 $2,205,159 $2,354,573 $2,046,679 $3,516,347 17.37 13.82 12.86 13.50 14.55 20.67 17.63 21.18 20.02 10.81 11.00 10.00 12.01 12.46 9.50 10.63 11.99 9.33 12.38 8.69 17.52 17.14 17.62 16.76 18.01 16.69 19.45 26.17 25.86 26.12 26.28 25.93 26.53 25.74 27.57 27.54 27.52 27.57 27.61 27.57 27.64 13.65 26.58Step by Step Solution
There are 3 Steps involved in it
Step: 1

Get Instant Access to Expert-Tailored Solutions
See step-by-step solutions with expert insights and AI powered tools for academic success
Step: 2

Step: 3

Ace Your Homework with AI
Get the answers you need in no time with our AI-driven, step-by-step assistance
Get Started


