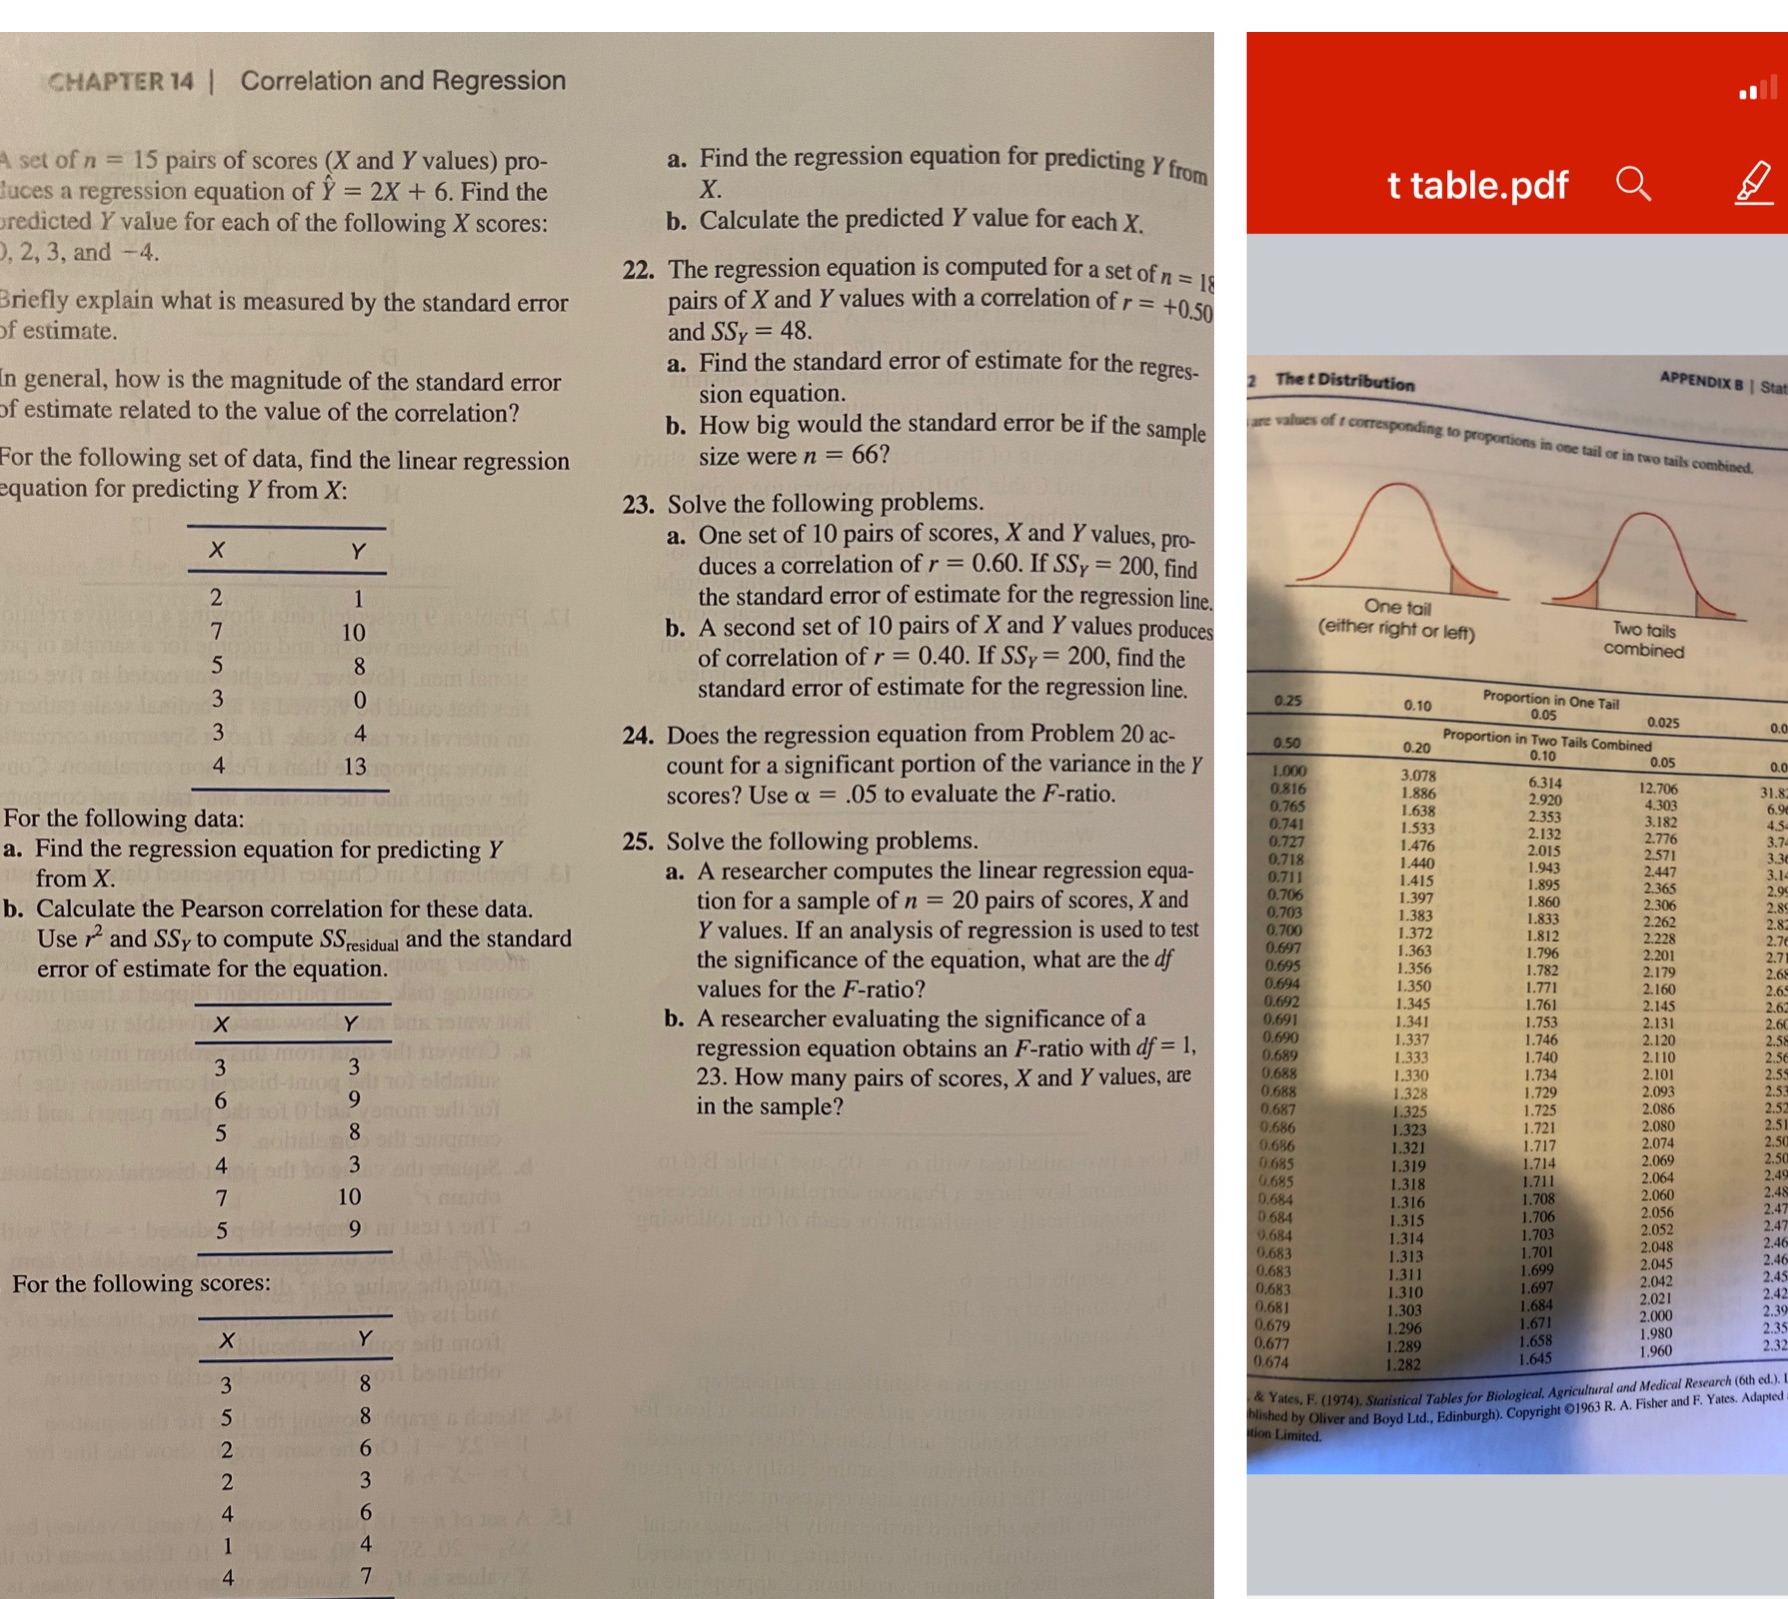
Please show step by step for all questions. Thank you
CHAPTER 14 | Correlation and Regression set of n = 15 pairs of scores (X and Y values) pro- a. Find the regression equation for predicting Y from luces a regression equation of Y = 2X + 6. Find the X. t table.pdf Q redicted Y value for each of the following X scores: b. Calculate the predicted Y value for each X. , 2, 3, and -4. 22. The regression equation is computed for a set of n = 18 Briefly explain what is measured by the standard error pairs of X and Y values with a correlation of r = +0.50 of estimate. and SSy = 48. In general, how is the magnitude of the standard error a. Find the standard error of estimate for the regres- The t Distribution APPENDIX B | Sta of estimate related to the value of the correlation? sion equation. b. How big would the standard error be if the sample are values of I corresp size were n = 66? ponding to proportions in one tail or in two tails combined. For the following set of data, find the linear regression quation for predicting Y from X: 23. Solve the following problems. X a. One set of 10 pairs of scores, X and Y values, pro- duces a correlation of r = 0.60. If SSy = 200, find IN the standard error of estimate for the regression line. One tail 10 b. A second set of 10 pairs of X and Y values produces (either right or left) Two tails of correlation of r = 0.40. If SSy = 200, find the combined 8 0 standard error of estimate for the regression line. 0.25 0.10 Proportion in One Tail 0.05 0.025 4 24. Does the regression equation from Problem 20 ac- 0.50 0.20 Proportion in Two Tails Combined 13 count for a significant portion of the variance in the Y 0.10 1.000 0.05 3.078 scores? Use a = .05 to evaluate the F-ratio. 0.816 1.886 6.314 2.920 12.706 0.765 1.638 4.303 For the following data: 0.741 2.353 1.533 3.182 a. Find the regression equation for predicting Y 25. Solve the following problems. 0.727 1.476 2.132 2.776 a. A researcher computes the linear regression equa- 0.718 2.015 1.943 2.571 from X. 0.711 2.447 1.895 b. Calculate the Pearson correlation for these data. tion for a sample of n = 20 pairs of scores, X and 1.860 2.306 1.383 Use r and SSy to compute SSresidual and the standard Y values. If an analysis of regression is used to test 1.833 2.262 1.372 1.812 2.228 the significance of the equation, what are the of 1.363 1.796 2.201 error of estimate for the equation. 1.356 1.782 2.179 values for the F-ratio? 0.694 1.350 1.771 2.160 0.692 1.345 1.761 2.145 X Y b. A researcher evaluating the significance of a 0.691 1.341 1.753 2.131 regression equation obtains an F-ratio with df = 1, 1.337 1.746 2.120 1.333 2.110 3 3 23. How many pairs of scores, X and Y values, are 1.330 9 1.328 2.093 6 in the sample? 1.325 1.725 2.086 1.323 2.080 8 1.721 0.686 1.321 1.717 2.074 3 1.319 1.714 2.069 1.318 1.711 2.064 10 said 1.316 2.060 0 684 1.315 1.706 2.056 9 0.684 1.703 2.052 0.683 1.313 1.701 0.683 1.311 1.699 For the following scores: 1.697 2.042 0,083 1.310 0.681 1 303 2.021 0.679 2.000 1,980 X Y 1.289 1.658 1.645 1.960 0.674 1.282 & Yates, F. (1974). Statistical Tables for Biological, Agricultural and Medical Research (6th ed.). lished by Oliver and Boyd Lid., Edinburgh). Copyright 1963 R. A. Fisher and F. Yates, Adapt lon Limited. - ANNUW


