Answered step by step
Verified Expert Solution
Link Copied!

Question

1 Approved Answer

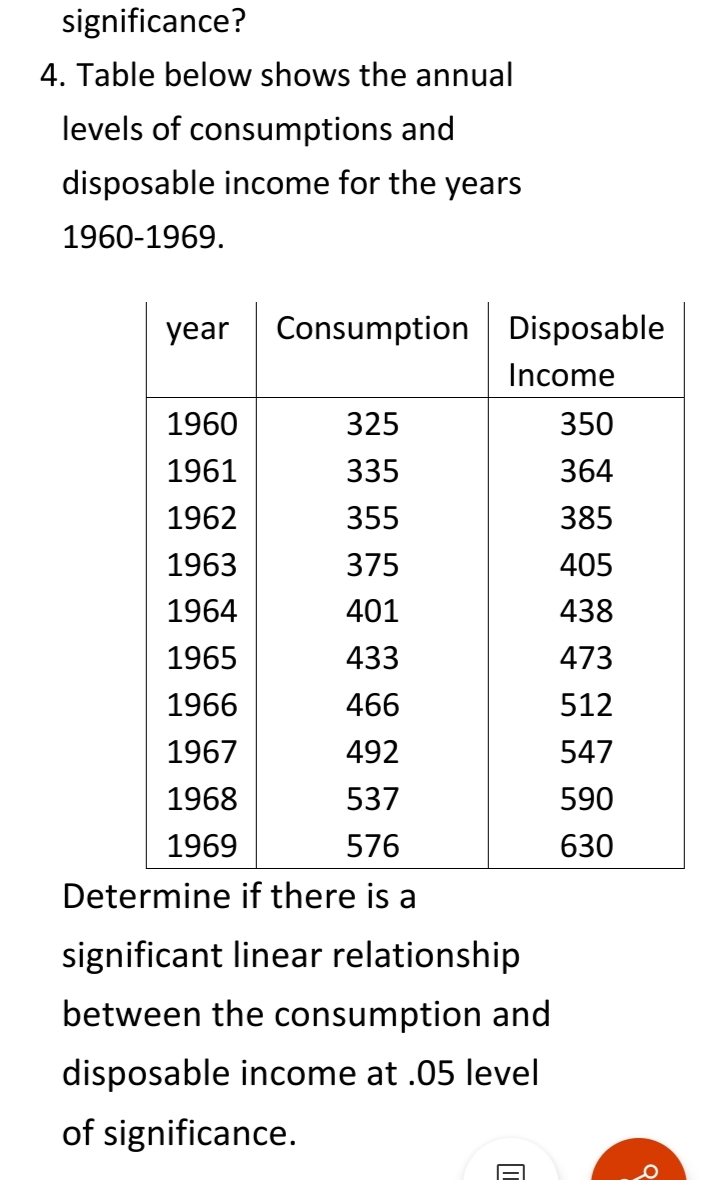
Please show step by step solution significance? 4. Table below shows the annual levels of consumptions and disposable income for the years 1960-1969. year Consumption

Please show step by step solution

image text in transcribed
significance? 4. Table below shows the annual levels of consumptions and disposable income for the years 1960-1969. year Consumption Disposable Income 1960 325 350 1961 335 364 1962 355 385 1963 375 405 1964 401 438 1965 433 473 1966 466 512 1967 492 547 1968 537 590 1969 576 630 Determine if there is a significant linear relationship between the consumption and disposable income at .05 level of significance. a A

Step by Step Solution

There are 3 Steps involved in it

Step: 1

blur-text-image

Get Instant Access to Expert-Tailored Solutions

See step-by-step solutions with expert insights and AI powered tools for academic success

Step: 2

blur-text-image

Step: 3

blur-text-image

Ace Your Homework with AI

Get the answers you need in no time with our AI-driven, step-by-step assistance

Get Started

Recommended Textbook for

Calculus

Authors: Laura Taalman, Peter Kohn

1st Edition

1464153035, 9781464153037

More Books

Students also viewed these Mathematics questions

Question

What skills would a project manager need?

Answered: 1 week ago

Question

3. Define the roles individuals play in a group

Answered: 1 week ago