Please show steps so I can understand clearly 1) (5 points): As part of a study on the socio-economic status (SES) and stress levels of

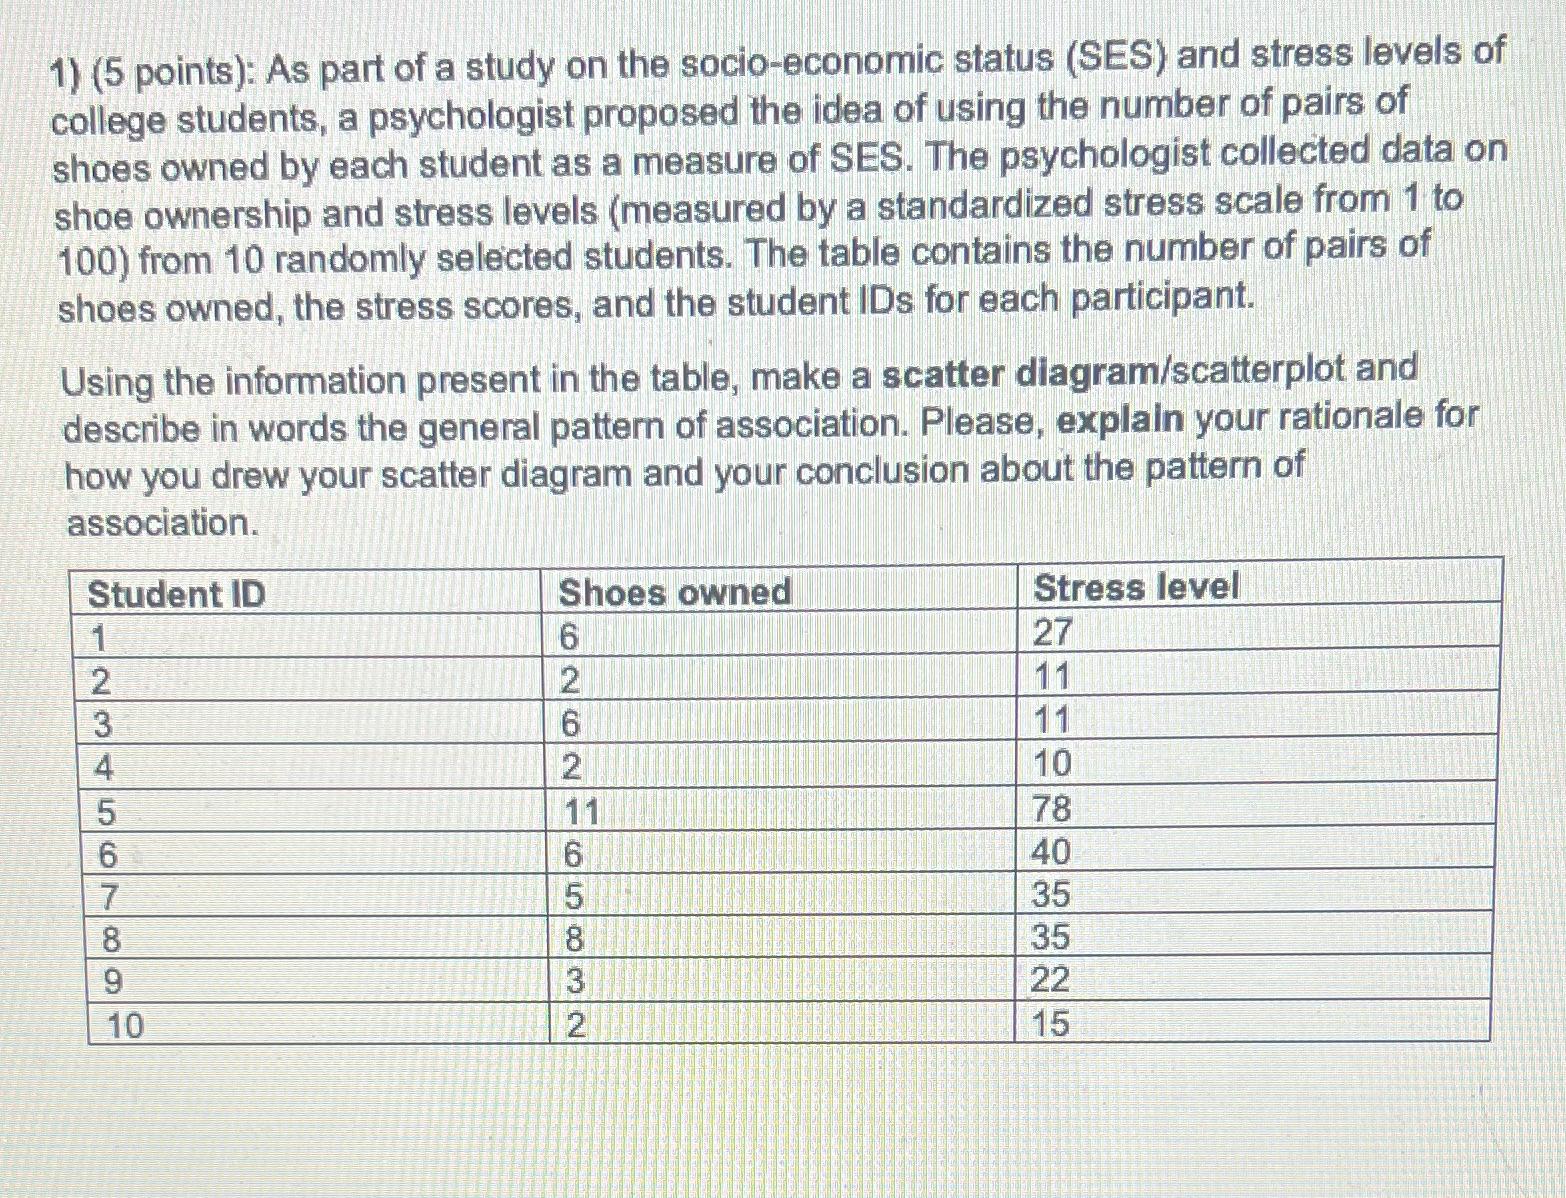
1) (5 points): As part of a study on the socio-economic status (SES) and stress levels of college students, a psychologist proposed the idea of using the number of pairs of shoes owned by each student as a measure of SES. The psychologist collected data on shoe ownership and stress levels (measured by a standardized stress scale from 1 to 100) from 10 randomly selected students. The table contains the number of pairs of shoes owned, the stress scores, and the student IDs for each participant. Using the information present in the table, make a scatter diagram/scatterplot and describe in words the general pattern of association. Please, explain your rationale for how you drew your scatter diagram and your conclusion about the pattern of association. Student ID 1 2 Shoes owned Stress level 6 27 2 11 3 6 11 4 2 10 5 11 78 6 6 40 7 5 35 8 8 35 9 3 22 10 2 15
Step by Step Solution
There are 3 Steps involved in it
Step: 1

See step-by-step solutions with expert insights and AI powered tools for academic success
Step: 2

Step: 3

Ace Your Homework with AI
Get the answers you need in no time with our AI-driven, step-by-step assistance
Get Started


